
When Airbnb Leaves Town: How New York’s Short-Term Rental Ban Hit Local Restaurants

In this post, together with Kaihang Zhao (PhD student in Marketing at Emory University) and Tal Shoshani (PhD student in Marketing at the University of Southern California), we examine the unintended consequences of policies regulating the short-term rental (STR) market.
Platforms such as Airbnb have revolutionized the way people travel. With just a few clicks, travelers can access a vast and diverse array of lodging options (spare rooms, condos, or entire homes), often at prices well below those of traditional hotels. The broader supply of temporary accommodations lowers the overall cost of visiting a city, potentially attracting more visitors.
Indeed, research shows that Airbnb attracts tourists who might not have visited otherwise and that its decentralized network of listings shifts tourism away from traditional hotel districts and into residential neighborhoods. This spatial redistribution of visitors can reshape urban spending patterns, increasing revenues for local restaurants, cafés, and neighborhood-based services.
However, critics argue that STR platforms also reduce the supply of long-term rental housing, inflate rents, and disrupt community life. In response, many U.S. cities have introduced increasingly stringent regulations, which require host registration, cap the number of rental nights, or prohibit the short-term rental of entire homes. While these policies are intended to stabilize housing affordability and preserve neighborhood character, they may also generate unintended ripple effects on local economic activity.
In September 2023, New York City enacted one of the strictest short-term rental regulations in the United States. The new rules required hosts to register with the city and prohibited most entire-home rentals unless the host was physically present during the stay. Within two months, the number of active Airbnb listings dropped from roughly 23,000 to just 4,600.
This effectively eliminated the majority of the city’s Airbnb market, and had an immediate effect on hotel prices. According to news reports, by December 2023, three months after the new regulations took effect, New York City’s average daily hotel rate had surged by 11%, reaching approximately $393 per night. Over the same period, revenue per available room (RevPAR) increased by 15.6%, compared to a national rise of only about 0.3%.
This drastic policy offers a unique opportunity to examine how restricting short-term rentals affects local economic activity, particularly in the restaurant sector, one of the neighborhood services that, as discussed above, tends to benefit from the decentralized flow of tourists facilitated by Airbnb.
Using detailed monthly credit and debit card transaction data from SafeGraph, covering thousands of restaurants across major U.S. cities between July 2022 and July 2024, we analyze how restaurant spending evolved before and after New York City’s 2023 regulation. Our empirical strategy combines propensity score matching with a difference-in-differences framework, comparing spending trends in New York City to those of a matched control group of restaurants in other major cities.
The results are striking: following the implementation of the regulation, restaurant spending in New York City declined by approximately 10% on average relative to the control group. The figure below plots the monthly changes in restaurant spending for New York City restaurants compared with their matched controls during the year preceding and following the policy’s implementation (the red dashed line indicates the month immediately preceding the policy's effect).
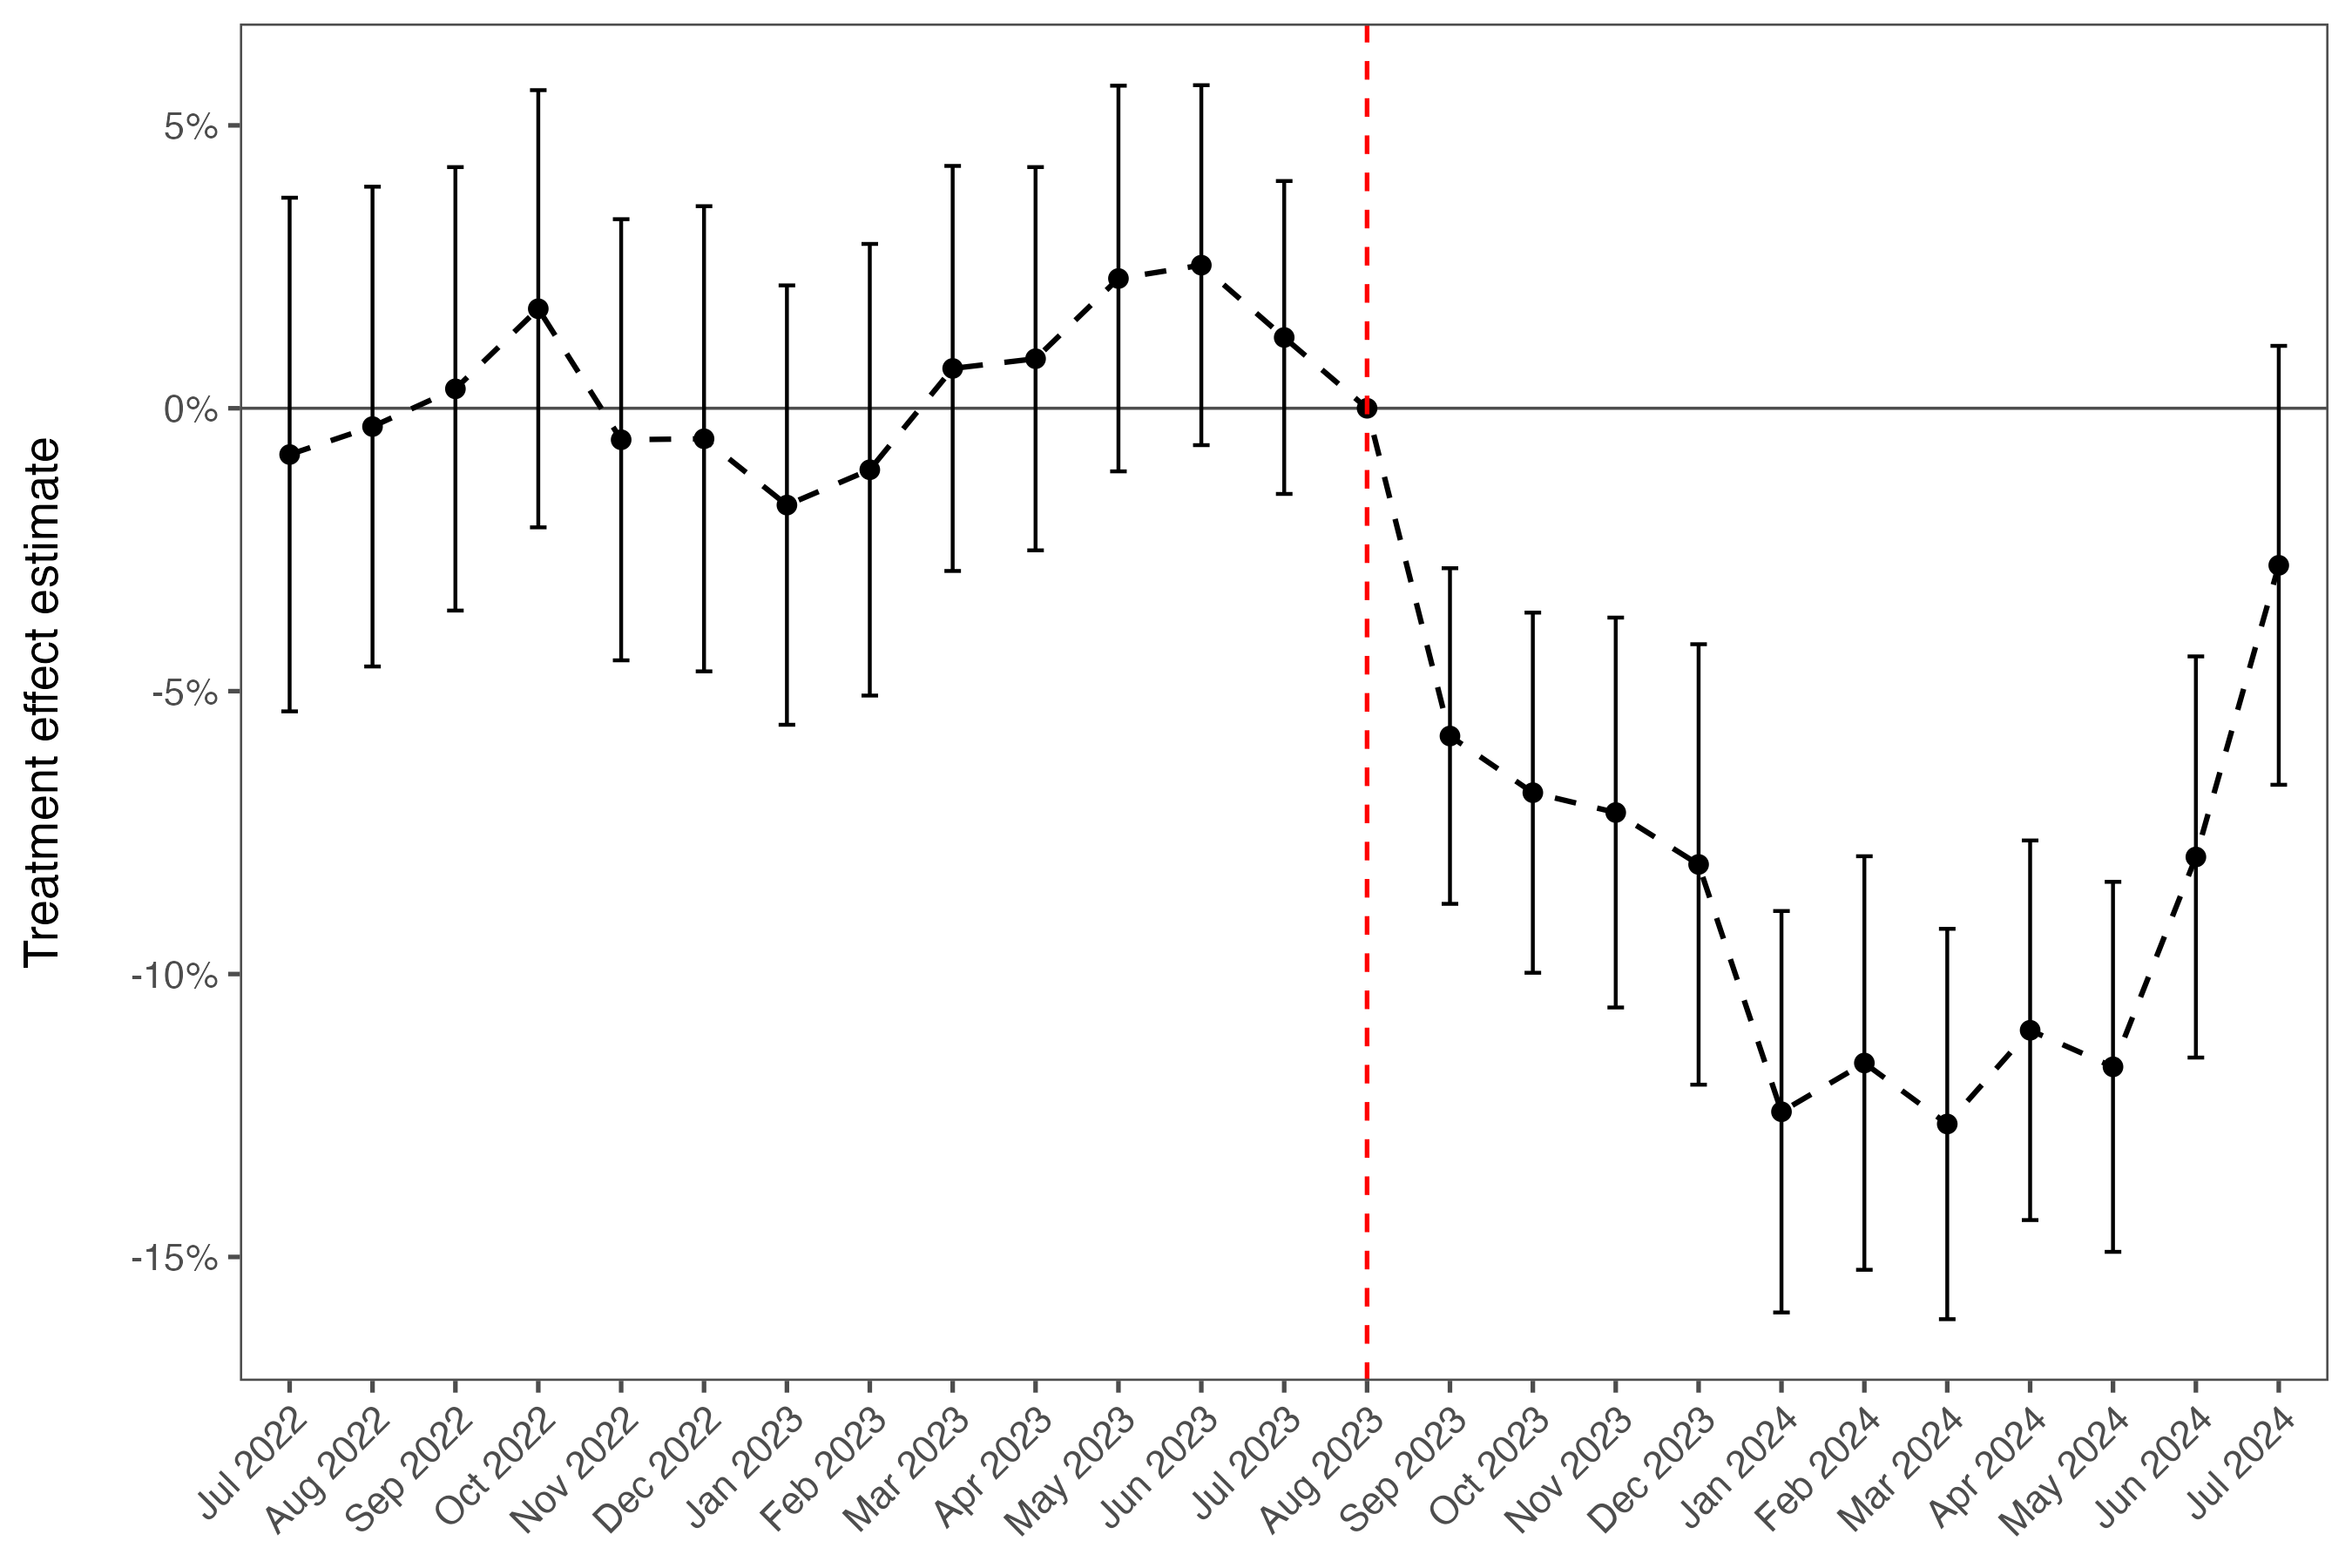
First, the figure shows that in the pre-regulation period (before September 2023), differences in spending between treated and control restaurants were close to zero, indicating that their spending trends were similar prior to the policy change. After the regulation took effect (September 2023 and after), restaurant spending in New York City declined steadily for approximately four months before stabilizing around five months after the policy's implementation, with a peak reduction of approximately 12% relative to the control group.
To put these results in perspective, we provide a back-of-the-envelope estimate of the implied revenue loss. The dataset used in the analysis includes 3,220 restaurants and debit and credit card transactions from roughly 9 million customers. However, New York City as a whole has far more restaurants and a much larger consumer base than what is represented in this sample.1 According to the Office of the New York City Comptroller, taxable sales at restaurants and other eating places totaled $26.904 billion between September 2023 and August 2024.2 Assuming that the observed decline in restaurant spending extends to the entire industry, and approximating the decline as a 10% reduction over the year, the counterfactual level of sales in the absence of the policy would have been $26.904 billion / (1 – 0.10) = $29.893 billion. The implied revenue loss is therefore the difference between the observed revenue ($26.904 billion) and the counterfactual revenue ($29.893 billion), amounting to approximately $2.989 billion.
Finally, we look at which restaurants are more affected by the STR policy. We find that the spending decline is particularly pronounced among higher-priced restaurants and establishments that cater to a larger share of non-local customers. These are the businesses most reliant on tourism demand.
In summary, New York’s 2023 short-term rental regulation had clear side effects on neighborhood economies. By cutting the supply of decentralized short-term accommodations and driving up hotel prices, it squeezed travelers’ budgets and dampened demand for restaurants and other local services. The broader lesson is that when crafting rules for platforms like Airbnb, policymakers need to consider not just housing affordability but also the local economic ecosystems that depend on tourism and short-term visitors.
In 2019, New York City had approximately 23,650 restaurant establishments. See: https://www.osc.ny.gov/files/reports/osdc/pdf/nyc-restaurant-industry-final.pdf.
See: https://comptroller.nyc.gov/wp-content/uploads/documents/The-State-of-the-Citys-Economy-and-Finances-2024.pdf