

The fate of downtowns following the COVID stay-at-home shock has been extensively debated by policymakers and researchers. A persistent decline in activity and occupancy in downtown offices could lead to a contraction of local economic activity, and declines in property tax assessments, fees, and other levies. The lost revenue could then significantly hurt city finances (the office real estate apocalypse).
In this post, we use some unique data from the city of Chicago to provide a perspective on this debate. Unlike other major U.S. cities, Chicago publishes a daily count of all turnstile entries at every station of the ‘L’ trains, going back to 2001.
We use these data to show the COVID contraction and subsequent recovery of urban rail passenger volume for the entire city and for the downtown area. While volume declined more sharply downtown during COVID, this part of the city has recovered more quickly, closing the gap. Still, in 2025 passenger volume remains 35% lower than in 2019.
Next, we merge the data with employer job counts at the census-block level. This lets us identify which stations are close to office jobs and thus more exposed to a persistent decline in the flow of office workers. We find that downtown stations with the highest concentration of (pre-pandemic) office jobs lag other stations in the same area. The high “office exposure” stations are back to only 58% of 2019 traffic, compared to 70% for downtown stations with the lowest exposure. We find the same gap when we look at exposure to specific sectors that employ office workers: Information, Professional & Corporate Management, Administrative Support, and Finance, Insurance & Real Estate.
In summary, the distribution of the drop in urban train passengers across downtown reveals the importance of the large decrease in office attendance.
Data
This section describes our data sources and analysis approach in detail.
CTA station entries. These data consist of daily turnstile counts for 143 stations. Note that these are entries only, so for downtown stations the data mainly record the evening trip home. We define the downtown central ring as the 37 stations within 4 km of State & Madison.
LODES 2019 office jobs. The Census Bureau’s LEHD program matches jobs to establishment locations at the census block level, along with employer industry sectors. We use 2019 (pre-pandemic) data and define four office-jobs sectors: Information (tech and media), Professional & Corporate Management, Administrative Support, and Finance, Insurance & Real Estate.
Train station office jobs exposure. The share of office-using jobs (out of all jobs) within a half-mile walk of each station is our office-exposure measure. Downtown (the central ring) is the only area of the county with high office concentration close to train stations, and thus is the only area in which it makes sense to study high exposure train stations. Note that LODES matches job locations, but not attendance, so an area with a high concentration of office jobs may have lower train station entries if employees are working from home. As we discuss later in the post, this is likely what is driving our results.
Trends in Traffic on the Train System
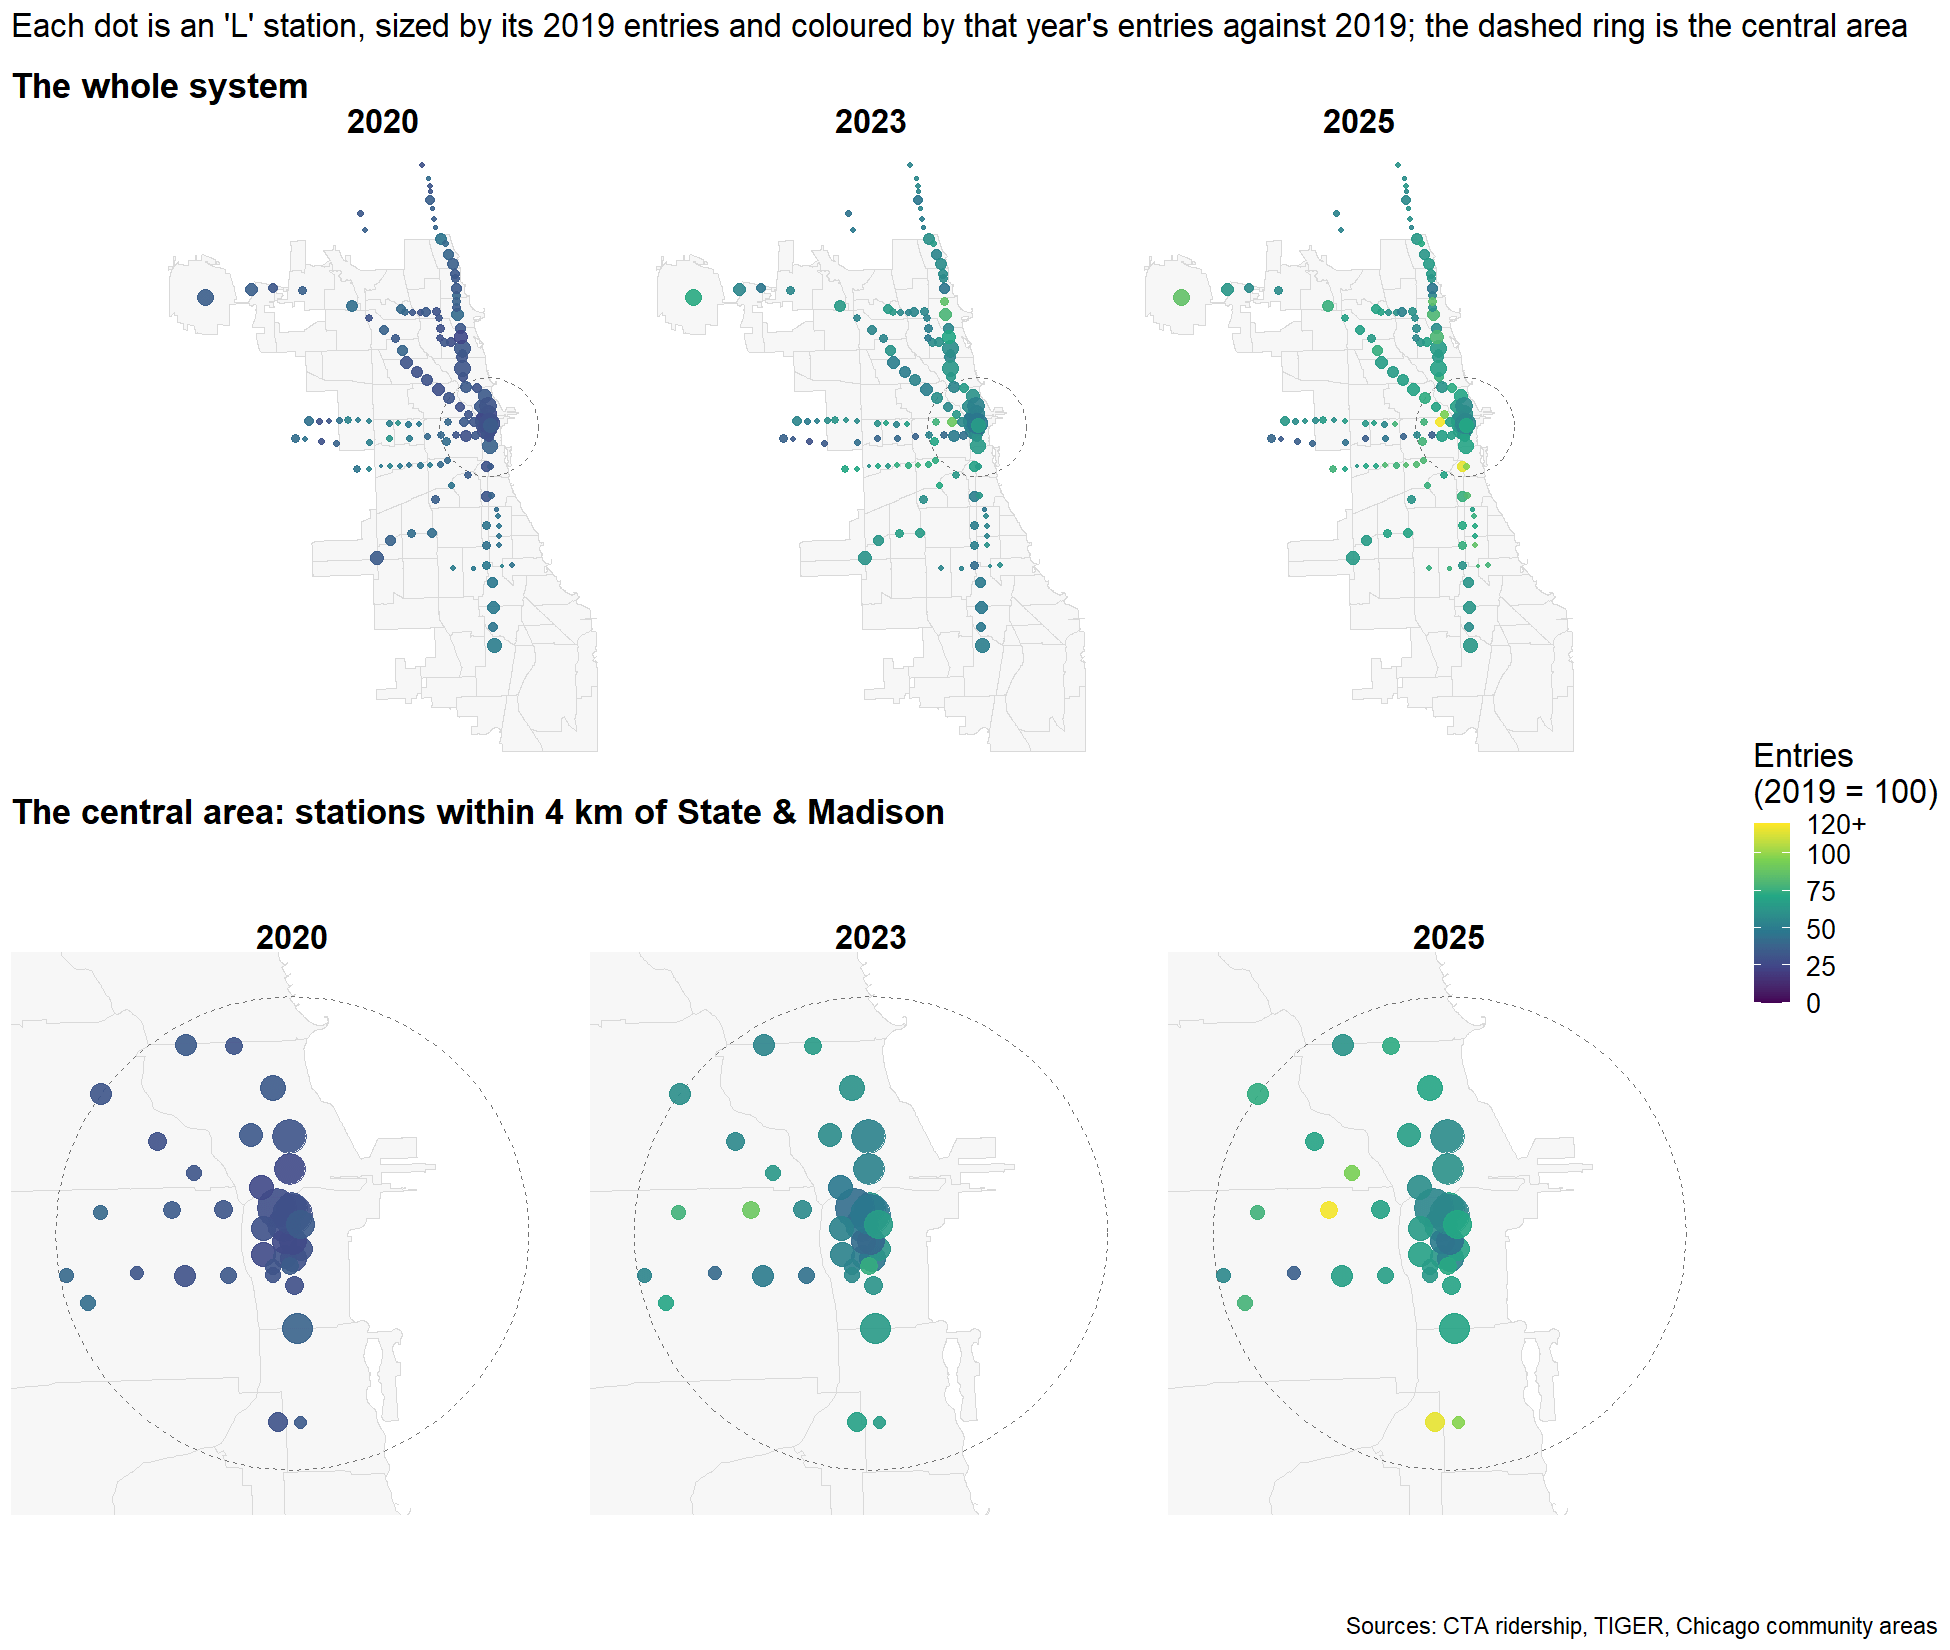
The figure below shows relative changes in turnstile entries for each station across Chicago (top panels) and in the downtown central ring (bottom panels). Each dot is a station, and the size is proportional to 2019 (pre-pandemic) station entries. It is evident how heavily traffic is concentrated in the downtown train stations. The dark blue colors correspond to steep station-level drops in entries, while light green and yellow correspond to values closer to the 2019 level or above it.
In 2020, during the shutdowns, train stations across the entire city are dark blue. By 2025, many stations have moved to a green shade, but substantial differences remain, even across downtown.
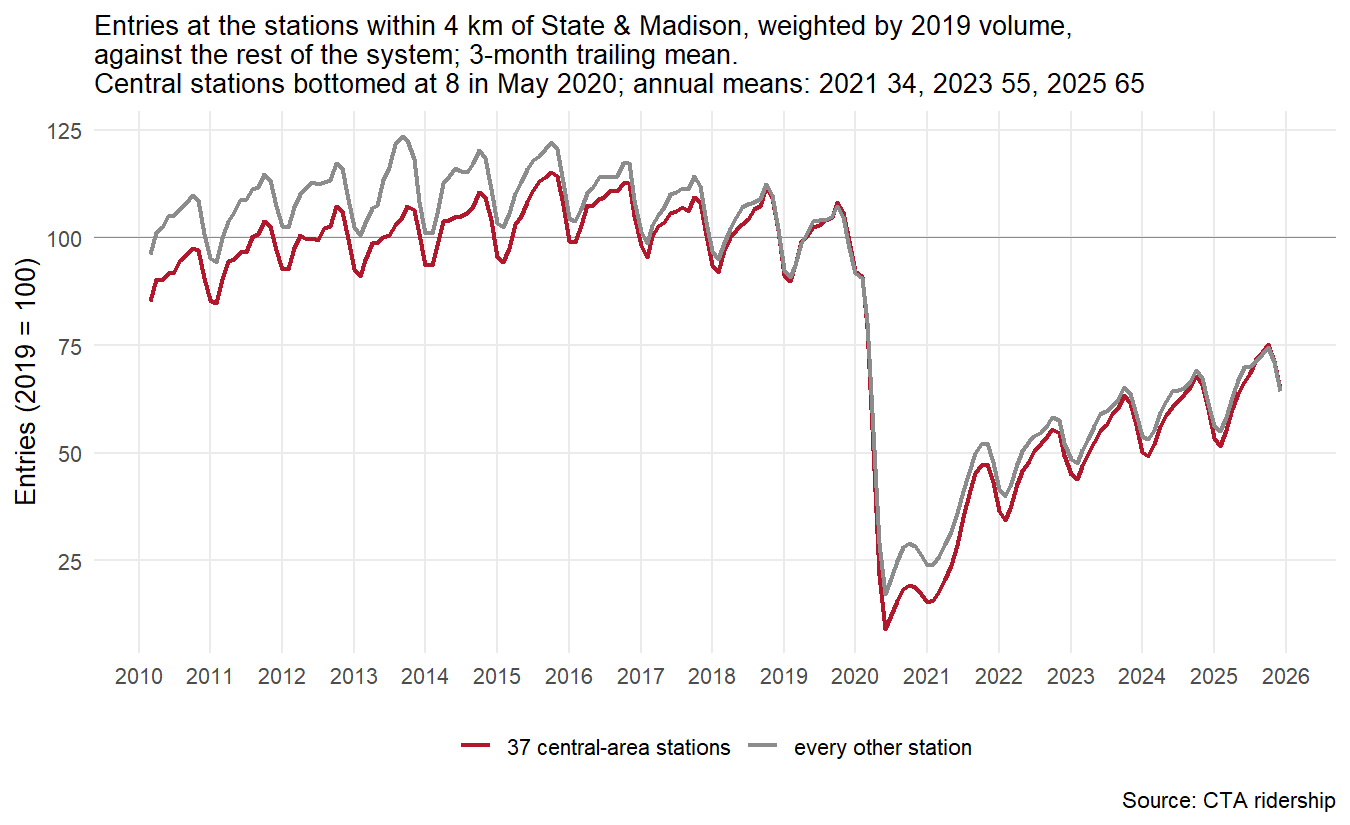
Our next figure visualizes the COVID drop and recovery in the aggregate, for the rest of the city (in grey) and for the 37 downtown central ring stations (in red).
In the spring of 2020, the downtown stations fell harder than the rest of the city, bottoming at 8% of 2019 traffic in May (the rest of the city bottomed at 15%). However, the central stations have caught up with the rest of the system, and by 2025 the two groups have nearly converged (65% against 66%). The interesting variation is inside downtown.
Are Office Jobs Holding Back Downtown Traffic?
We now shift our analysis to the station level. We calculate, for each downtown station, the total number of jobs within a half-mile, and the share of jobs belonging to each of four office-using categories (Information, Professional & Corporate Management, Administrative Support, and Finance, Insurance & Real Estate). We also calculate the share of jobs belonging to any of the four categories. This fifth category captures the overall concentration of office employment near each station.
Then, for each category, we split the 37 stations into the third most exposed (highest shares), the intermediate third, and the third least exposed (lowest shares). The figure below plots, for each tercile and each category, the ratio of 2025 to 2019 daily passenger volume (turnstile entries). Diamonds mark the ratios of May 2020, the month when ridership hit its lowest point, to 2019.
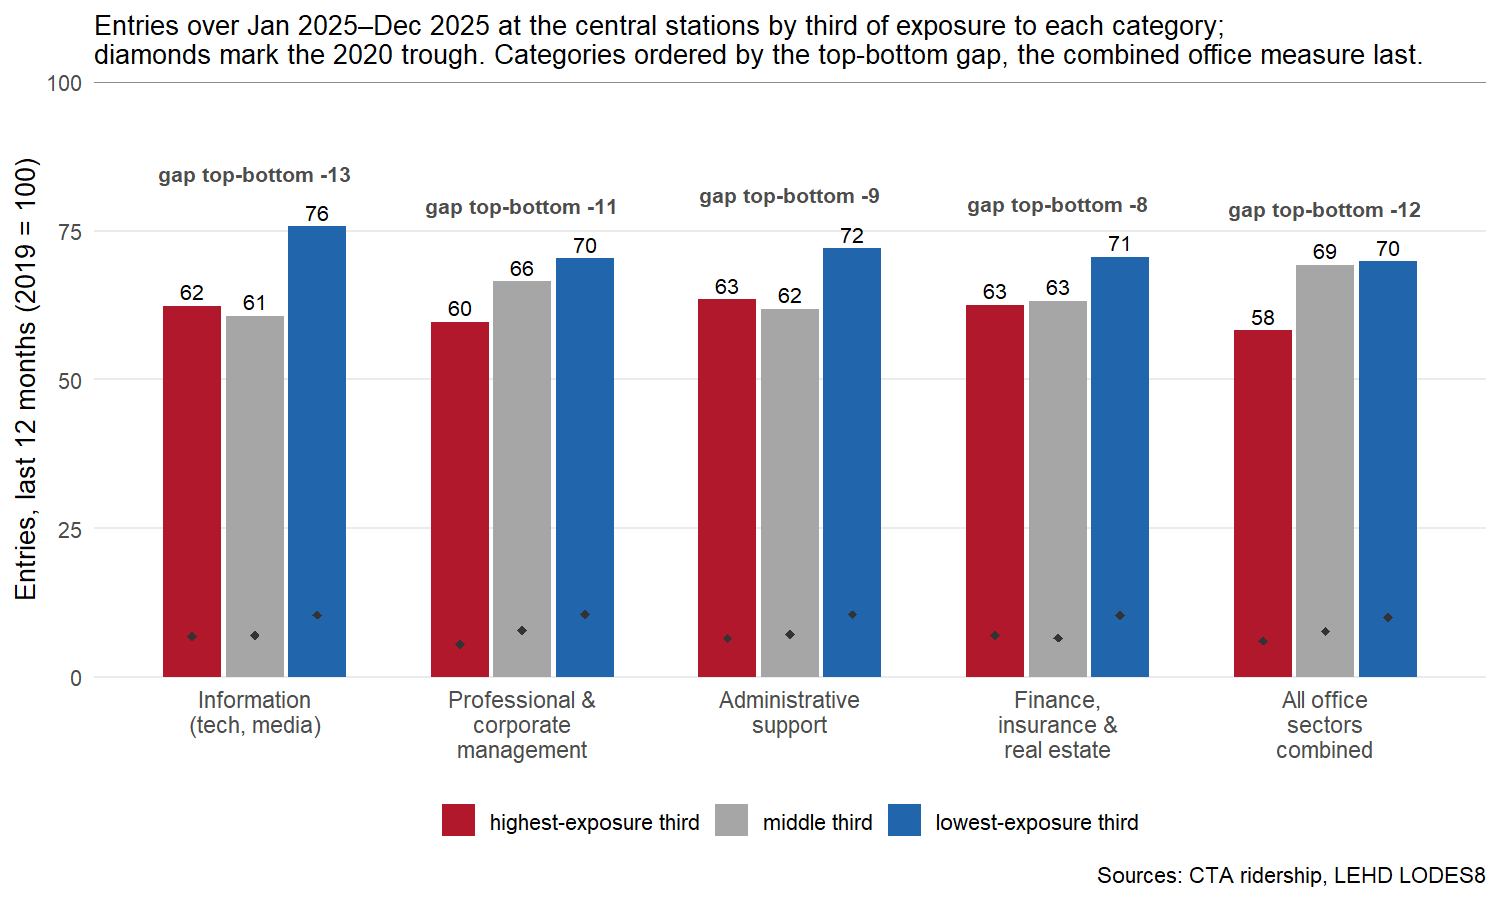
In 2020, every station bottomed out at roughly the same depth, whether or not it was surrounded by office jobs. There were some differences between most exposed and least exposed stations, but they were small. By 2025, the gaps had grown. Stations in the most office-exposed third (combining all office jobs) ran at 58% of their 2019 entries against 70% for the least-exposed third: a twelve-point gap.
The component categories line up the same way: information-exposed stations are at 62% against 76% (a thirteen-point gap, the widest), professional and corporate management are at 60% against 70%, administrative support at 63% against 72%, and finance, insurance & real estate at 63% against 71%.
For the combined measure of all office jobs, the middle third of stations by exposure is close to the bottom third (69% against 70%), so the gap is really driven by the stations where office work is most concentrated.
Offices haven’t left (at least, not yet)
If we compare LODES data in 2019 and 2023, combined employment for the office-using categories in the downtown area grew 10.8%, from 359,000 to 398,000 jobs. Thus, at least for now, the effects on train stations are not driven by fewer jobs. However, they are likely driven by remote and hybrid work. Indeed, job growth was strongest in information (+19%) and professional services (+15%), both sectors that have adopted work-from-home extensively.
Conclusion
COVID has left a persistent mark on urban transit, even five years after the shutdowns. While we do not find a lasting gap between downtown and the rest of the city, within downtown, proximity to office jobs coincides with a slower recovery.
The implication is that the persistent decline in office attendance is visible and is reshaping downtown. The effects on the distribution of services and economic activity, and on real estate values, are far-reaching.
Our analysis highlights how cities can monitor this important phenomenon using the trove of transit data they already collect for administrative purposes. High-quality rail transit data allow us to generate a sharp picture for Chicago.