
What Has Happened to Homeowner and Renter Mobility Over the Past Decade?
We document several important trends in the U.S. Census SIPP data.

How frequently do homeowners move? At what rate do renters transition into homeownership? And how have these patterns changed over time? These questions sit at the heart of ongoing debates about housing affordability, market liquidity, and the health of the U.S. housing market.
Over the past decade, a convergence of rising home prices, demographic shifts, and the historically unusual phenomenon of mortgage rate lock-in have reshaped who moves, when, and why.
We use nationally representative data from the U.S. Census Bureau’s Survey of Income and Program Participation (SIPP) to trace transitions within and between owning and renting. We track mobility at both the individual and household level across three panels covering 2013–2016, 2017–2020, and 2021–2023.
The picture that emerges is complex, with some expected results, some surprising facts, and several subtleties in the data that are essential for proper interpretation:
There is no clear trend in owner-to-owner moves, although there is a sharp drop in 2021–2023, consistent with recent industry and academic research on mortgage rate lock-in.
There is a strong, steady decline in renter-to-renter mobility over the entire period.
Moves from owner-occupied homes to rentals are surprisingly frequent and have dropped sharply in 2021–2023, consistent with what suggested by recent research. However, these flows do not directly map into home sales or downsizing. Rather, they are significantly driven by young adults and other individuals breaking away from their current households. Thus, they need to be interpreted with care.
Basic Facts from Individual-Level Statistics
To understand mobility trends, consider adults living in an owner-occupied home as facing one of three possible transitions each year: remaining in the same owner-occupied home, moving to a new owner-occupied home, or moving into a rental. The same framework applies to renters: they can remain in the same rental, move to another rental, or transition into an owner-occupied home.
The figure below summarizes the annual transition rates for individuals who do not remain in the same housing unit: owner-occupiers (top panel) and renters (bottom panel) who move to a new owned or rented home. We produce estimates for each of the three historical panels constructed from the SIPP data.
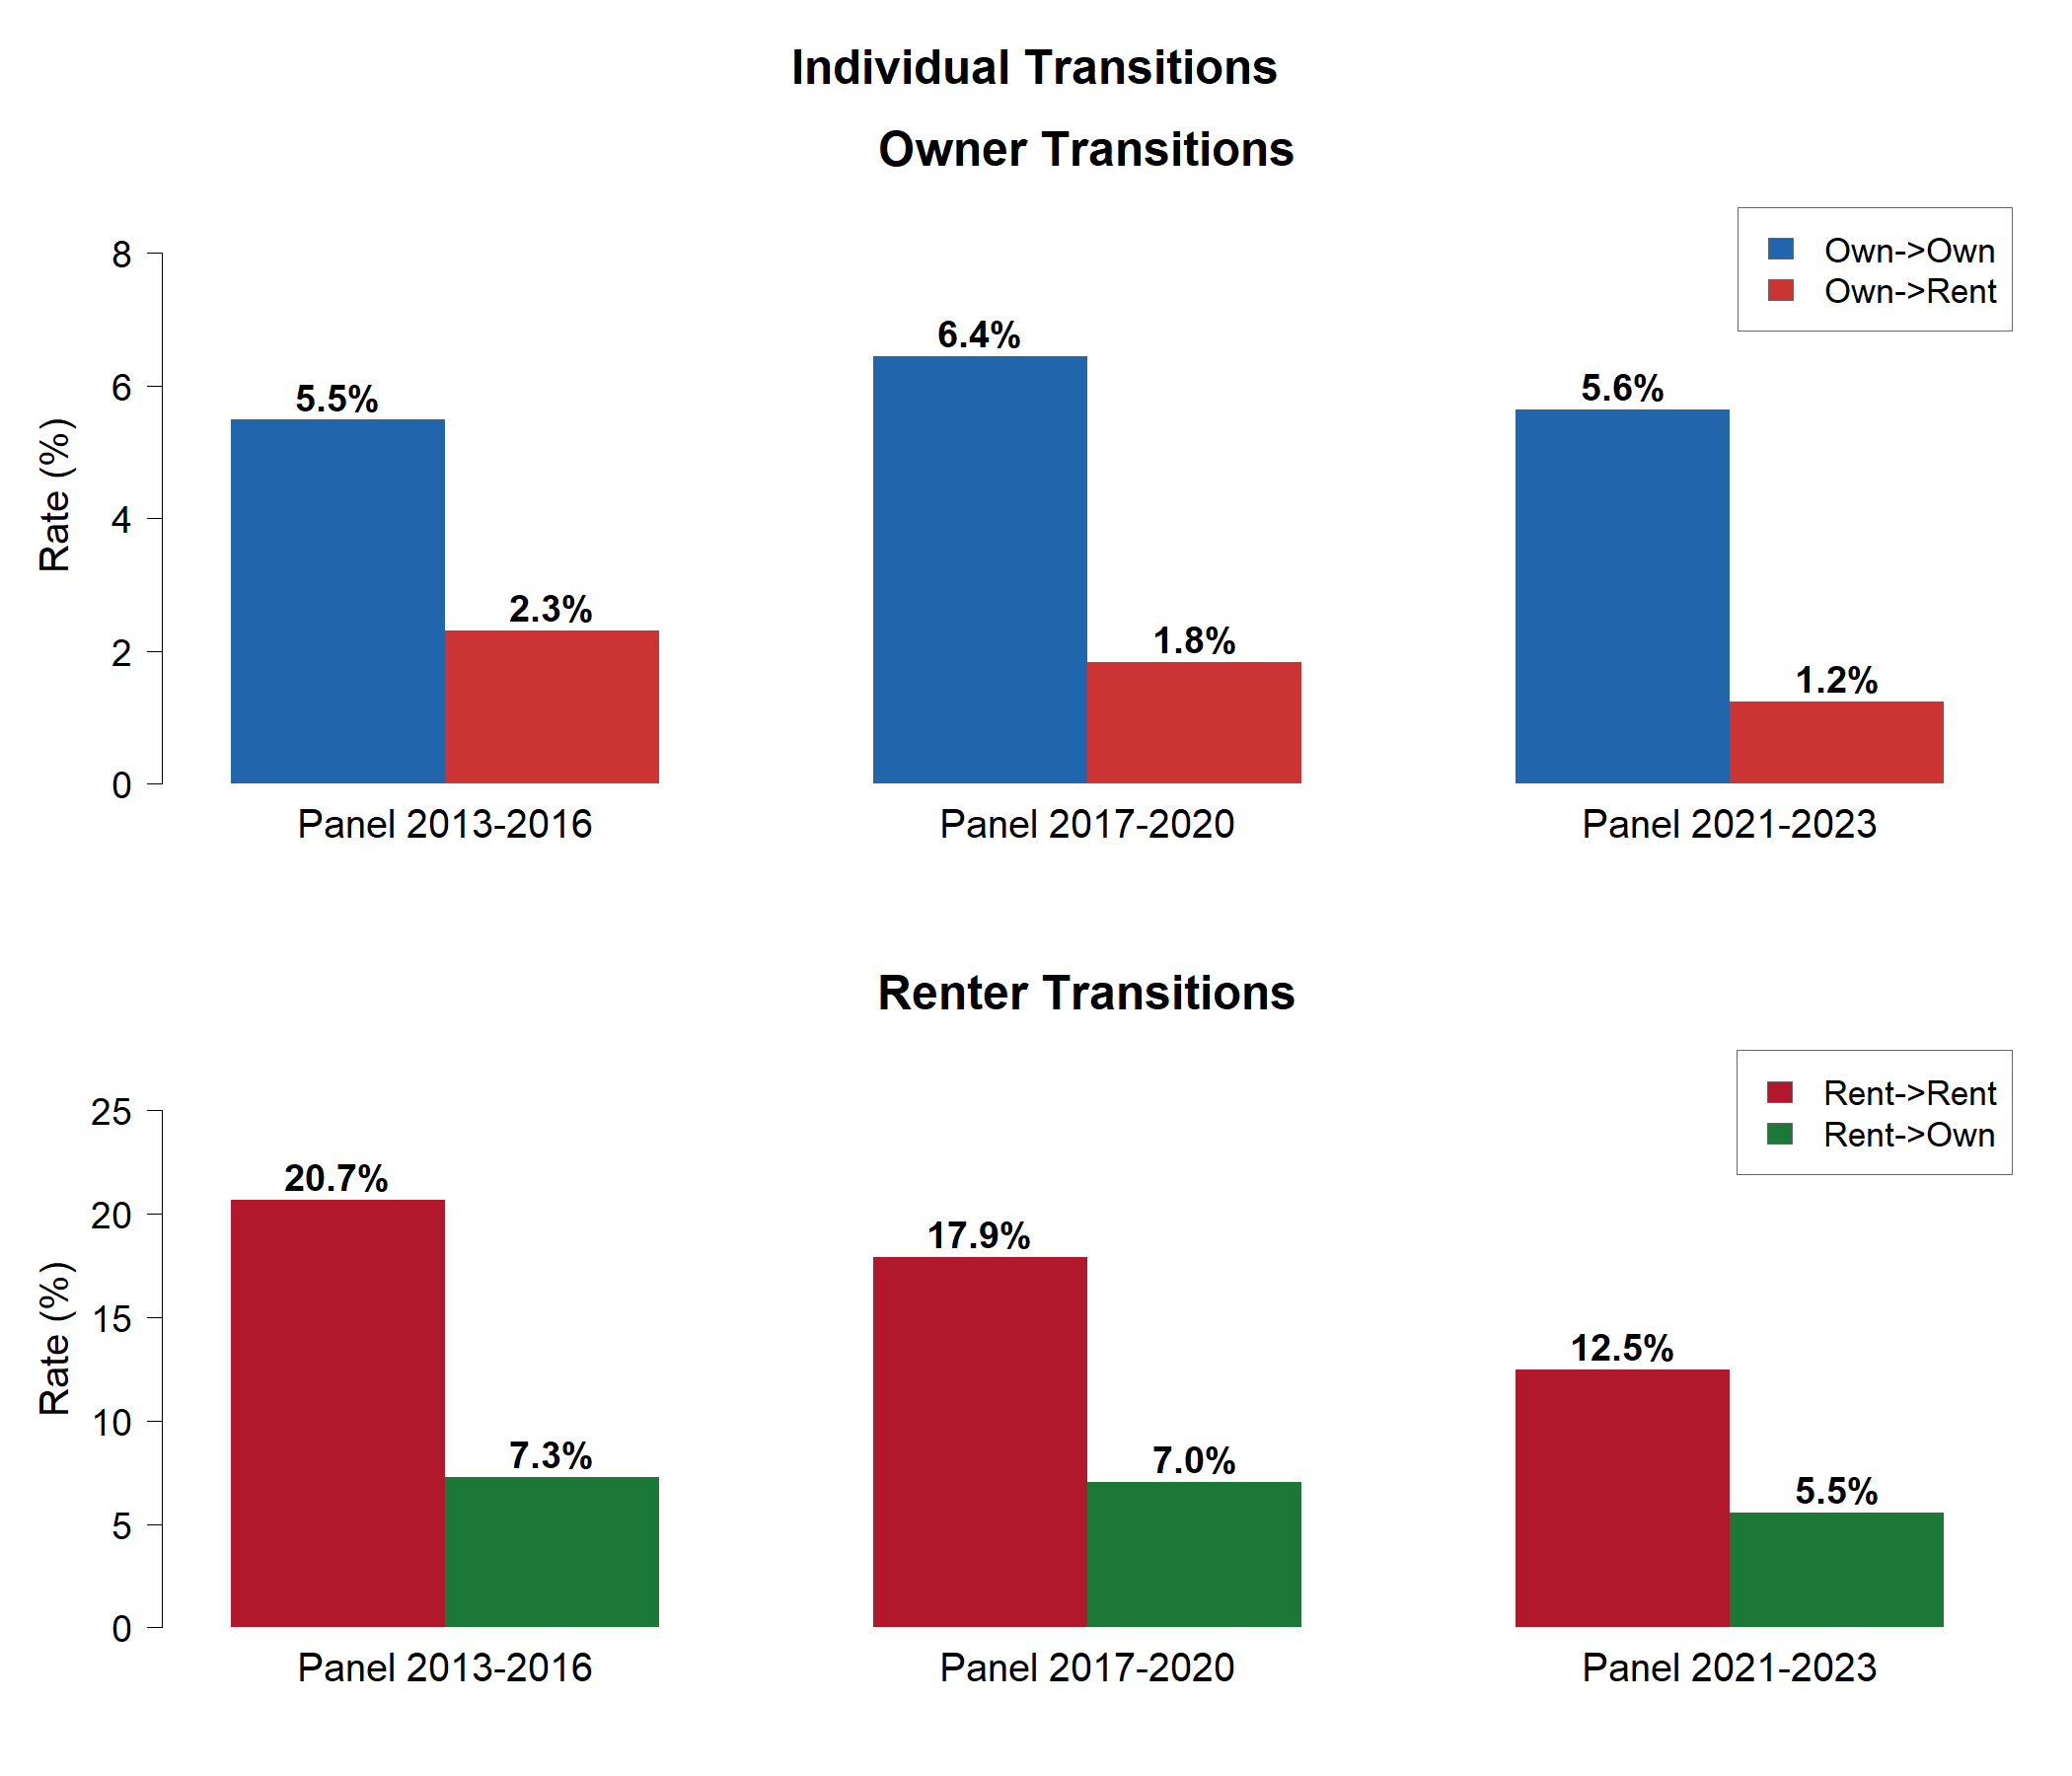
In 2013–2016, the share of owner-occupier individuals moving to another owner-occupied home is 5.5% per year. This increases to 6.4% in 2017–2020, before falling back to 5.6% in 2021–2023. The reversal aligns closely with the onset of mortgage rate lock-in. millions of homeowners who secured rates near historic lows in 2020–2021 now face a steep financial penalty for selling and repurchasing at much higher mortgage rates. The result is a housing market in which owners sit tight, reducing turnover, which is consistent with the findings of Fonseca and Liu (2024).
Interestingly, the data also reveal a large flow from owning to renting. In 2013–2016, 2.3% of owner-occupier individuals moved to a rental each year. This means that own-to-rent moves account for approximately 30%1 of all owner moves in that period. This is a somewhat surprising finding, but aligns with recent evidence discussed by Katz (2024).
This rate drops dramatically over time and is halved by the 2021–2023 panel, in which only 1.2% of owner-occupiers move to rentals. Katz (2024) argues that this empirical fact may have major implications for the effects of lock-in on house prices. However, the nature of these moves is somewhat unclear. Are they really capturing households selling their homes to become renters? As we show below, the answer is more nuanced than it first appears.
Another striking trend is that renter-to-renter mobility has steadily declined over time. In 2013–2016, roughly one in five renters moved to a different rental unit each year. By 2021–2023, that figure had dropped to approximately one in eight, a decline of nearly 40% in less than a decade.
This trend may be tied to several mechanisms. High rents and tight budgets may discourage renters from bearing the costs of relocating. Alternatively, renters’ preferences may be changing, making them less inclined to move.
Transitions from renting to homeownership have also declined, consistent with the progressive decrease in ownership affordability and the sustained growth in house prices. However, the magnitude of this decrease is more modest, with the annual transition rate falling from 7.3% in 2013–2016 to 5.5% in 2021–2023.
Digging Deeper into Owners’ Mobility
To better understand mobility patterns for owners, we now examine transition rates for household heads. Note that these data include single-person households.
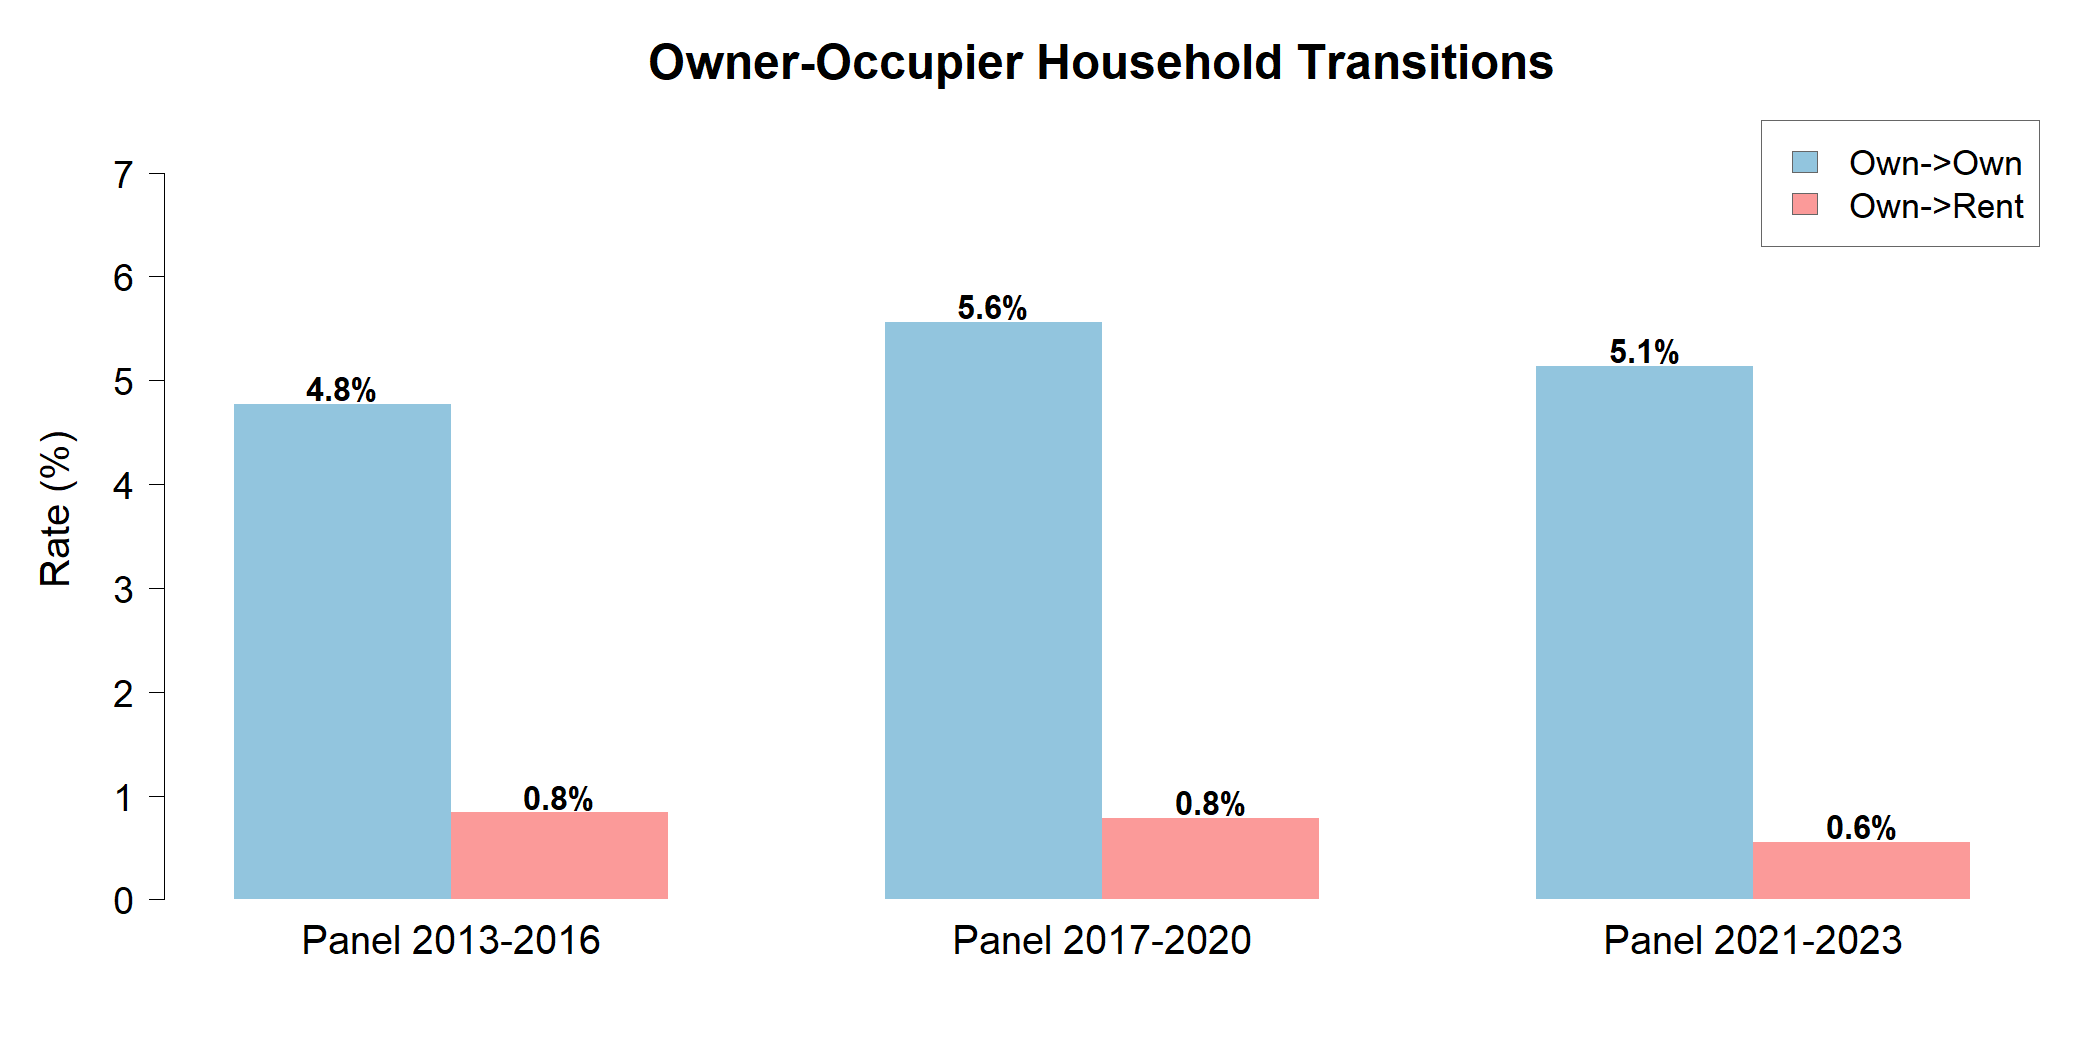
Interestingly, the household-level statistics diverge from the individual-level results in important ways. Owner-to-owner moves are roughly a 0.5 to 1 percentage point smaller for household heads than for all individuals.
The larger discrepancy appears in own-to-rent transitions, which are much less frequent for household heads than for individuals overall. This suggests that many of the individuals moving from an owner-occupied home to a rental are forming a new household (perhaps leaving a family home), or joining a different household. Thus, a large share of these moves is unlikely to reflect existing households’ decisions to sell and rent.
Notably, there is also relatively little change in own-to-rent transitions for household heads when comparing 2017–2020 to 2021–2023: the rate drops only from 0.8% to 0.6%, rather than the much larger decline from 2.3% to 1.2% observed at the individual level.
To dig deeper into this pattern, we examine a breakdown by age across all panels. The figure below plots the share of individuals and households transitioning from owner-occupied homes to rentals across age groups.
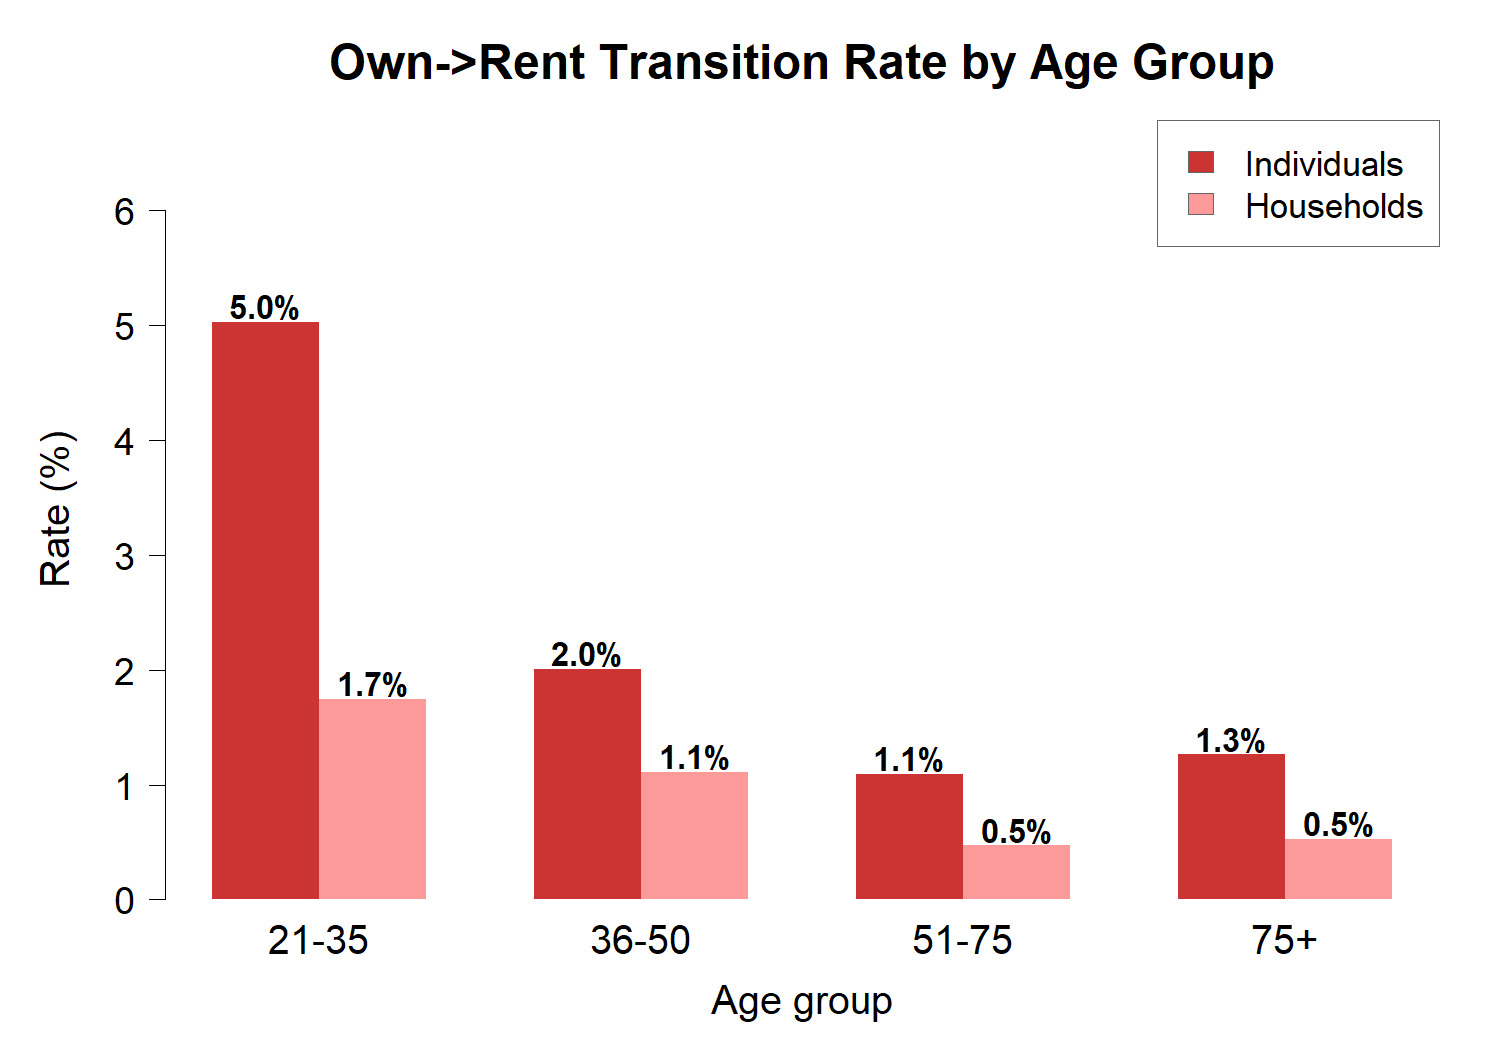
Two interesting facts emerge. First, the share of individuals making own-to-rent moves is highest among younger adults (those under 35) and adults under 50. This pattern is present for both individual and household moves, but is much more pronounced for individual moves. Thus, these transitions are not mainly driven by downsizing among older homeowners, and, in the individual data, may have something to do with younger adults leaving the household to become renters.
Second, individual-level transition rates are two to three times larger than household-level rates across all age groups. This further reinforces the interpretation that a substantial portion of own-to-rent moves at the individual level reflects changes in household composition rather than homeowners choosing to sell and become renters.
Conclusion
The SIPP is a valuable tool for studying individual and household mobility in the United States. While its data are subject to limitations, it allows us to highlight several important patterns. We find that mobility is changing in meaningful ways, and that some less well-known aspects of the data, such as the non-negligible frequency of own-to-rent moves, deserve more attention. However, as our analysis shows, these facts require careful interpretation: what appears at first glance to be homeowners becoming renters is, in large part, individuals (especially young ones) leaving their current households to form new ones.
We compute this estimate as 2.3% / (5.5% + 2.3%), which is approximately 29.5%