
What Building Permits Reveal About Climate Adaptation Spending
We use building permit microdata to estimate adaptation spending across U.S. states.

Investments to protect homes and commercial real estate from climate change and to repair damage from severe weather are becoming increasingly central to policy debate. Homeowners and businesses face substantial costs through private adaptation spending, whether to repair existing damage, prevent future losses, or comply with new local building codes.
Drawing on a dataset of over 200 million building permits across the United States, we identify 8.8 million climate and adaptation related permits filed between 2010 and 2024, representing an estimated $219 billion in private spending.
The Permit Data: Identifying Adaptation Expenses
We analyze building permit records from Builty, a comprehensive database covering all 50 U.S. states, and reporting over 200 million permits. For each permit, we classify whether it was adaptation-related using two complementary methods:
Boolean flags: The dataset includes a roof replacement indicator that directly identifies reroofing permits, the largest category of climate-related work.
Description keywords: For the 81% of permits with a text description, we search for terms associated with hurricane protection (impact windows, storm shutters, wind mitigation), flood adaptation (elevation, flood-proofing), fire damage repair, and storm damage.
We group the permits in five categories, shown in the table below:
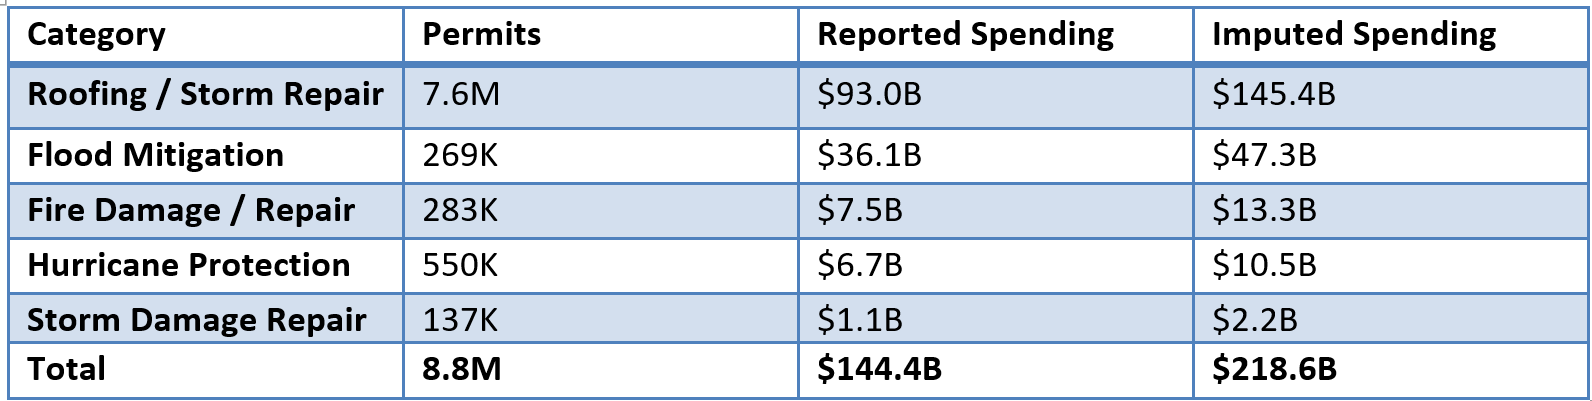
Roughly 44% of climate-related permits include a reported job value. For the remainder, we imputed values using the median job value for the same permit category, state, and year. The resulting $219 billion total should be read as an estimate, while the directly reported figure of $144 billion provides a conservative lower bound. Coverage is also imperfect and expands substantially over the sample period, so our estimates likely understate adaptation investment in the earlier years. Spending reaches roughly $25 billion per year in 2023 and 2024.
Roofing dominates the total, accounting for 67% of all spending. This is not surprising: roof replacement is both the most common home repair triggered by weather events and the most frequently permitted type of work.
We classify all roof replacements as weather-related, on the grounds that weather exposure (UV, hail, wind, and rain) is the primary determinant of roof lifespan. This convention is standard in the insurance industry, where roof age and storm exposure dominate claims data. It is nonetheless an aggressive classification: some roofs are replaced for cosmetic reasons or as part of broader renovations. If 20–30% of roofing turns out to be non-climate-driven, the true total would fall closer to $170-190 billion.
Where Adaptation Spending Is Highest
The figure below shows that climate adaptation spending is sharply unequal across states. To minimize biases in comparisons, we restrict this chart to 2020–2024, the years with the most reliable coverage, and to the 32 states in which at least 10% of permits report a job value and the average permit value falls within three times the national mean. States that fail these checks are excluded from the ranking. In most cases, these states have a handful of unusually expensive permits (likely commercial projects) that pull the average upward.
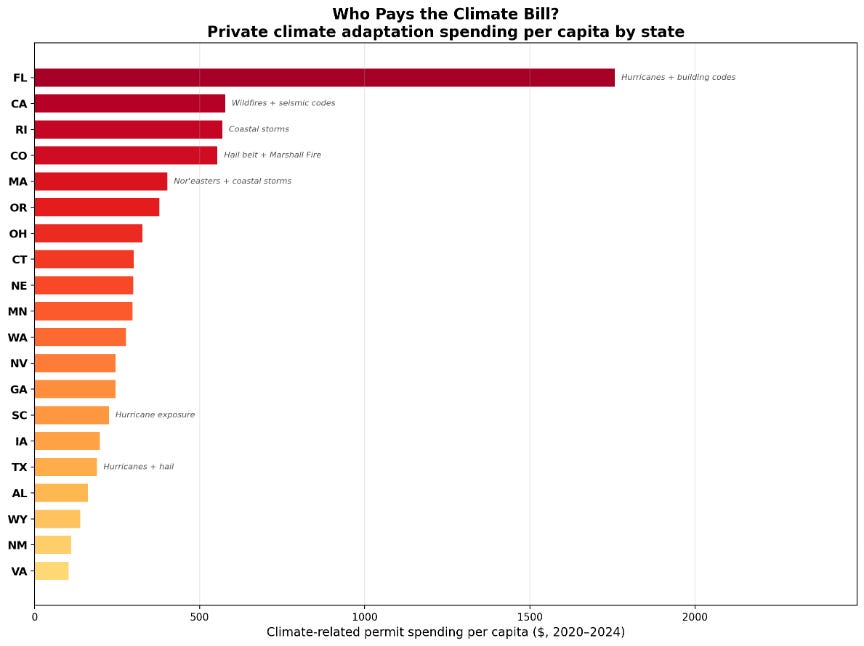
Florida is in a league of its own. Between 2020 and 2024, spending on climate-related building permits totaled $1,750 per person. This is more than triple the next-highest state. Florida’s exposure to Irma (2017), Michael (2018), Ian (2022), and Helene and Milton (2024), combined with one of the nation’s strictest wind-resistance building codes, means every roof replacement must now meet hurricane-rated standards. Each repair is therefore more expensive, but also more protective.
California ($580 per capita) ranks second, driven by wildfire damage repair and the state’s stringent fire-hardening requirements for construction in the wildland-urban interface. Rhode Island ($570) and Colorado ($550) follow, reflecting coastal storm exposure and the Front Range hail belt, respectively.
At the other end of the distribution, states like Virginia ($100 per capita) and New Mexico ($110) spend far less. Part of this gap reflects genuinely lower climate exposure in the built environment; part of it reflects thinner permit coverage in the dataset. The true gap is likely narrower than what appears here, but the broad pattern is robust: storm- and fire-exposed states have the highest spending.
The Hurricane Footprint
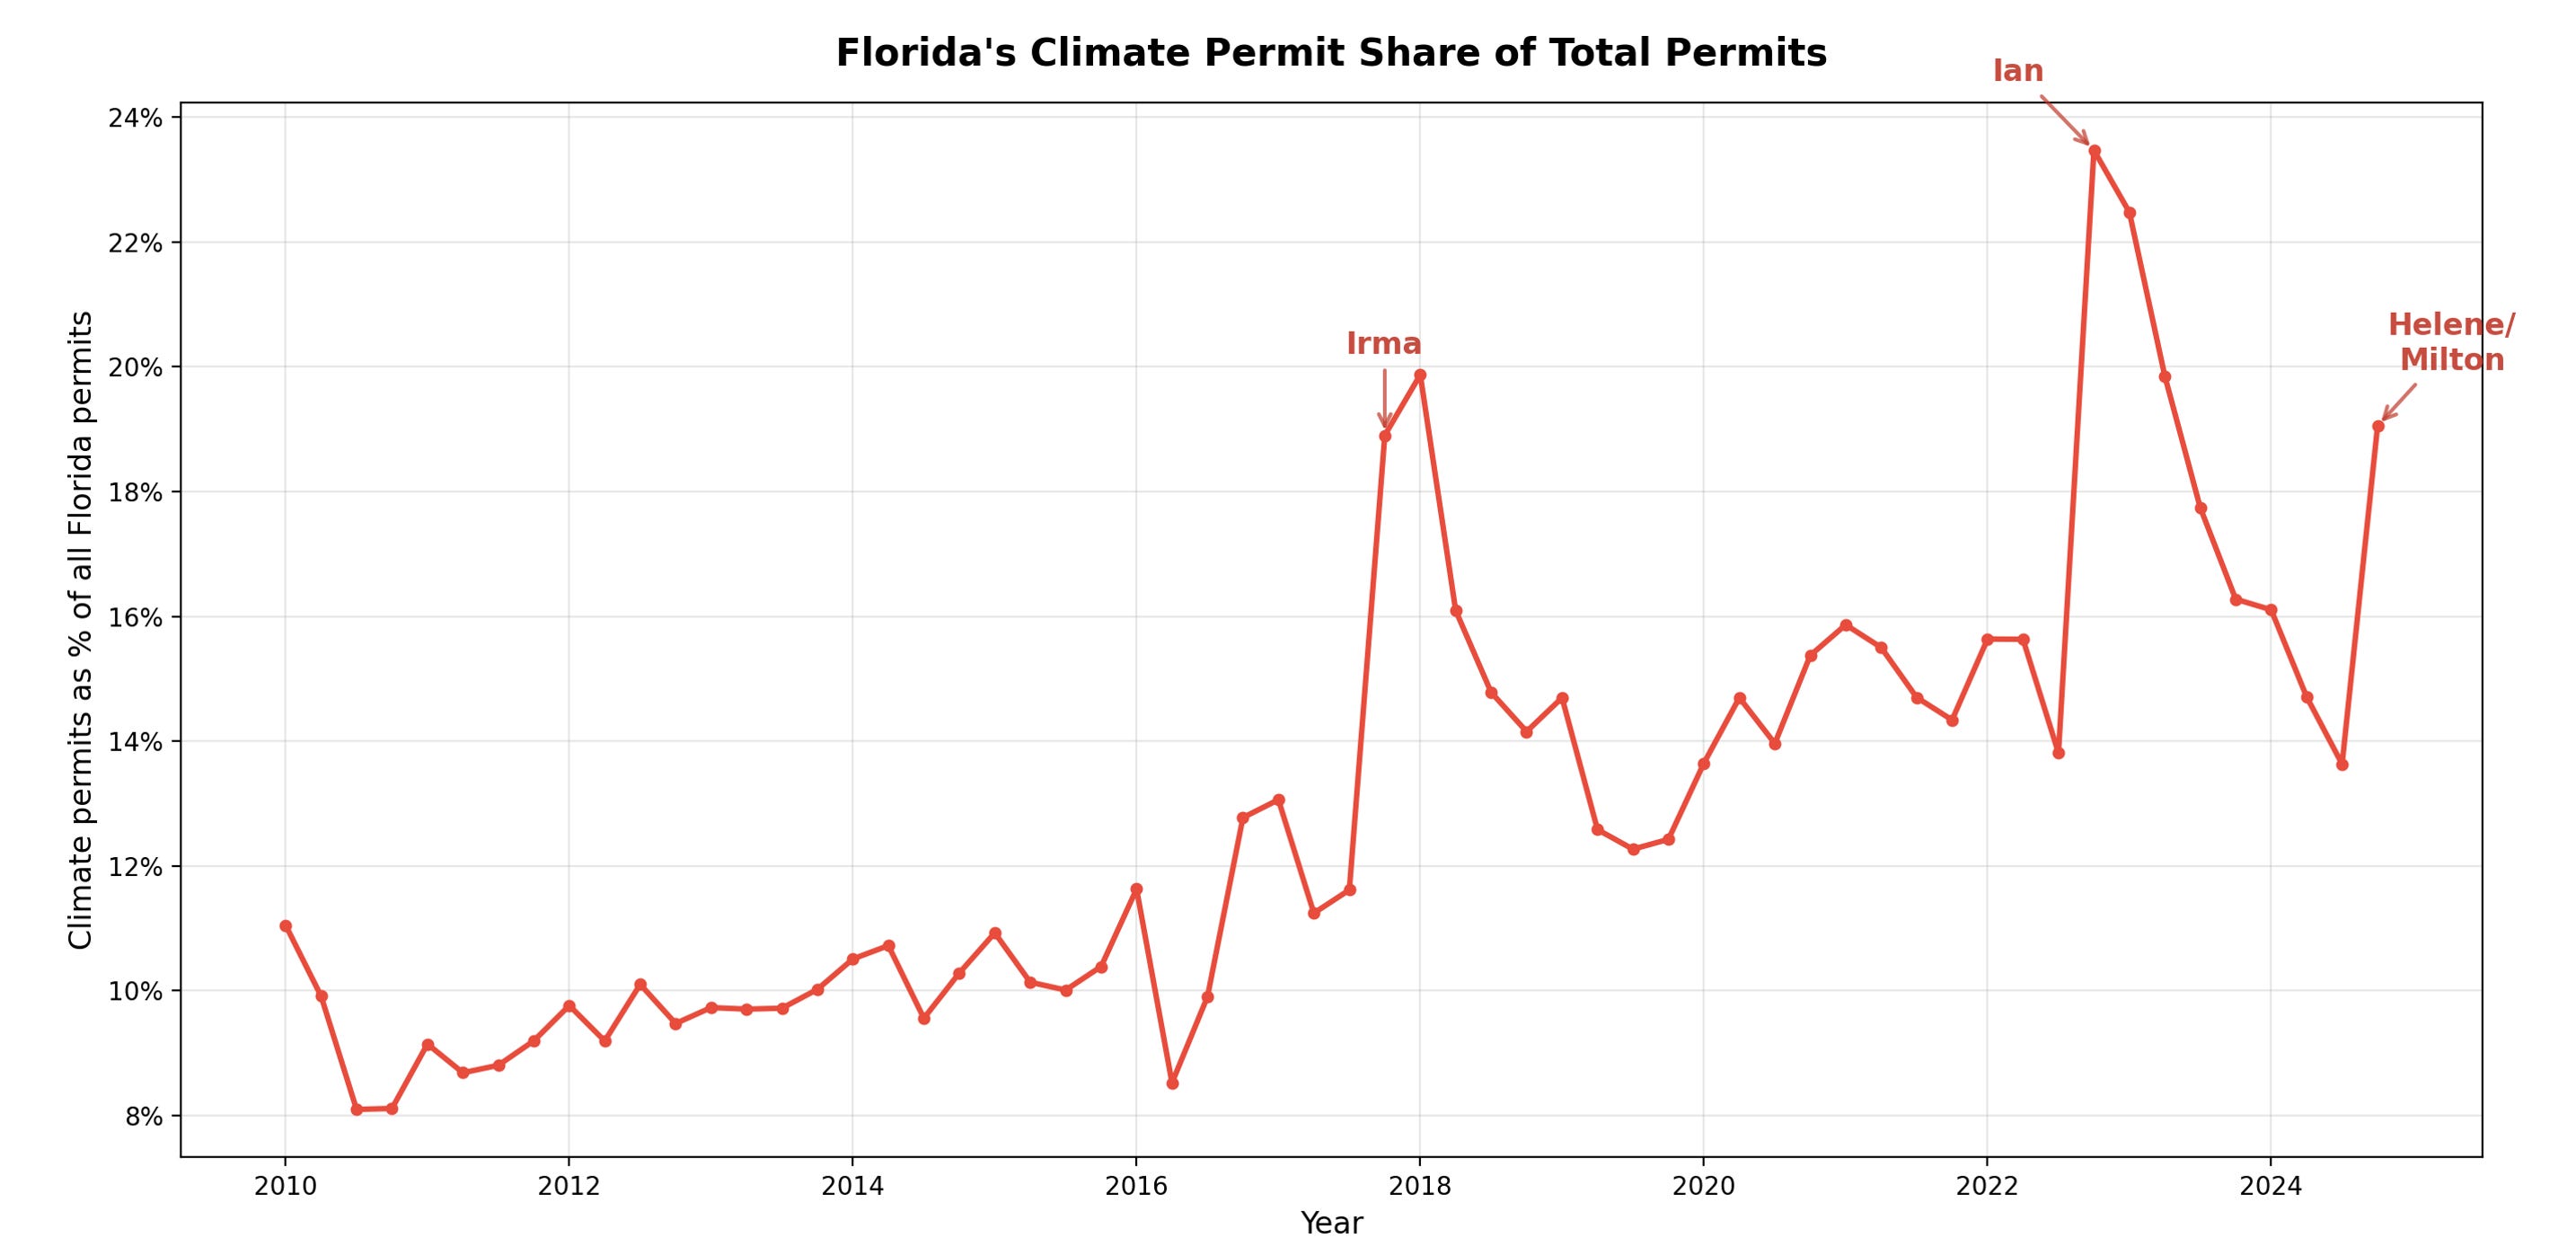
To show that the permit data captures the effects of individual disasters, we focus on Florida, the state with the largest adaptation spending. We compute climate-related permits as a share of all permits filed in the state, quarter by quarter. The share-based approach matters: if climate and non-climate permits grow in lockstep as new jurisdictions enter the dataset, the ratio stays flat. Thus, temporary fluctuations in the share that coincide with natural disasters represent genuine shifts in adaptation activity.
The figure below shows that the fingerprints of major hurricanes are clearly visible. Florida's climate permit share hovers around 8-10% through the early 2010s. Then Irma makes landfall in September 2017, and the share nearly doubles in a single quarter, from 12% to 19%. Ian repeats the pattern even more dramatically in late 2022, driving the share from 14% to 24%. Helene and Milton push it back to 19% in late 2024. Interestingly, between storms the share never fully retreats to pre-Irma levels, settling into a new baseline of 13-16%.
Conclusion
This post highlights how significant climate adaptation spending already is for homeowners and businesses, and how significant it is likely to remain.
The burden is also sharply concentrated. Spending in Florida amounts to more than $1,750 per capita. This is over triple the next-highest state and seventeen times what Virginians spend.
Building permits offer an underutilized lens on this landscape. While government agencies track disaster declarations and insurance claims, permit data captures the full spectrum of private adaptation spending, including the proactive efforts that take place outside the insurance system. As climate exposure broadens, this kind of bottom-up evidence will be essential for understanding who is paying, where, and how much.