
The Geography of Grocery Stores: Demographics, Disparities, and Store Closures
Insights from establishment-level data on grocery store locations and recent closure patterns.

Access to grocery stores is a determinant of neighborhood quality. Full-service supermarkets provide residents with fresh produce, proteins, dairy, and other products. When located within walking distance, grocery stores also reduce transportation costs and contribute to a community’s infrastructure. Conversely, the loss of a grocery store removes not only a food source but also jobs, foot traffic, and an anchor for the local economy.
Since the early 2000s, much of the U.S. policy discussion around food access has been focused on “food deserts”, which are areas where residents lack convenient access to affordable, nutritious food. The USDA defines these at the census-tract level, combining low income with low proximity to supermarkets.
While the number of Americans living in designated food deserts has declined in recent years (see Karpyn et al. 2019), the landscape of grocery stores has grown more complex, with the rise of premium grocers and substantial reorganization in the industry. Nationally, retail analysts project thousands of store closures in 2026, and grocery closures have been a persistent concern particularly in lower-income neighborhoods.
In this post, we analyze the spatial distribution of grocery store locations and closures across California, and highlight the distinct patterns for premium and conventional (non-premium) grocers. Our results are based on establishment-level data from SafeGraph combined with demographic information at the census block group-level from the American Community Survey.
The following patterns stand out:
There is massive demographic stratification in the locations of different types of stores. Premium stores target micro-locations with high-income renters. Conventional stores have a more even distribution, but lean, interestingly, toward lower-than-average income areas.
Store closures over the 2019-2025 period have been a significant phenomenon. They have only weakly impacted premium stores, and rather have been concentrated in conventional stores.
Store closures disproportionately affect areas with lower incomes, lower educational attainment, and higher Black and Hispanic/Latino population shares. Compared to state averages, these neighborhoods (census block groups) have 20% lower incomes, 6 percentage points (p.p.) lower share of bachelor-educated individuals, 10 p.p. higher share of Black and Hispanic/Latino residents, and 14 p.p. lower homeownership rates. A snapshot of closures in Los Angeles County shows that closures are also spatially concentrated.
The Spatial Distribution of Premium and Conventional Grocers
As of the end of 2025, we identify 13,407 open grocery stores and supercenters (large retail stores that also sell groceries, such as Target) across California, of which 186 (just 1.4%) belong to seven chains that we classify as premium based on brand and pricing: Whole Foods Market (94 locations), Gelson’s (27), Nugget Markets (17), Bristol Farms (13), Erewhon (11), Lazy Acres (6), and Draeger’s (2). The remaining 13,221 stores encompass conventional supermarket chains, discount grocers, ethnic specialty stores, and independent operators.
The demographic profiles of the neighborhoods that host premium and conventional grocery stores differ considerably. For this analysis, we link store locations to census block group demographics from the American Community Survey (ACS) 5-Year Estimates (2019–2023). Block groups are the smallest geographic unit for which the ACS publishes demographic estimates. They typically contain 600-3,000 people. We restrict our analysis to block groups with at least 100 residents (25,471 of 25,586 block groups in California).
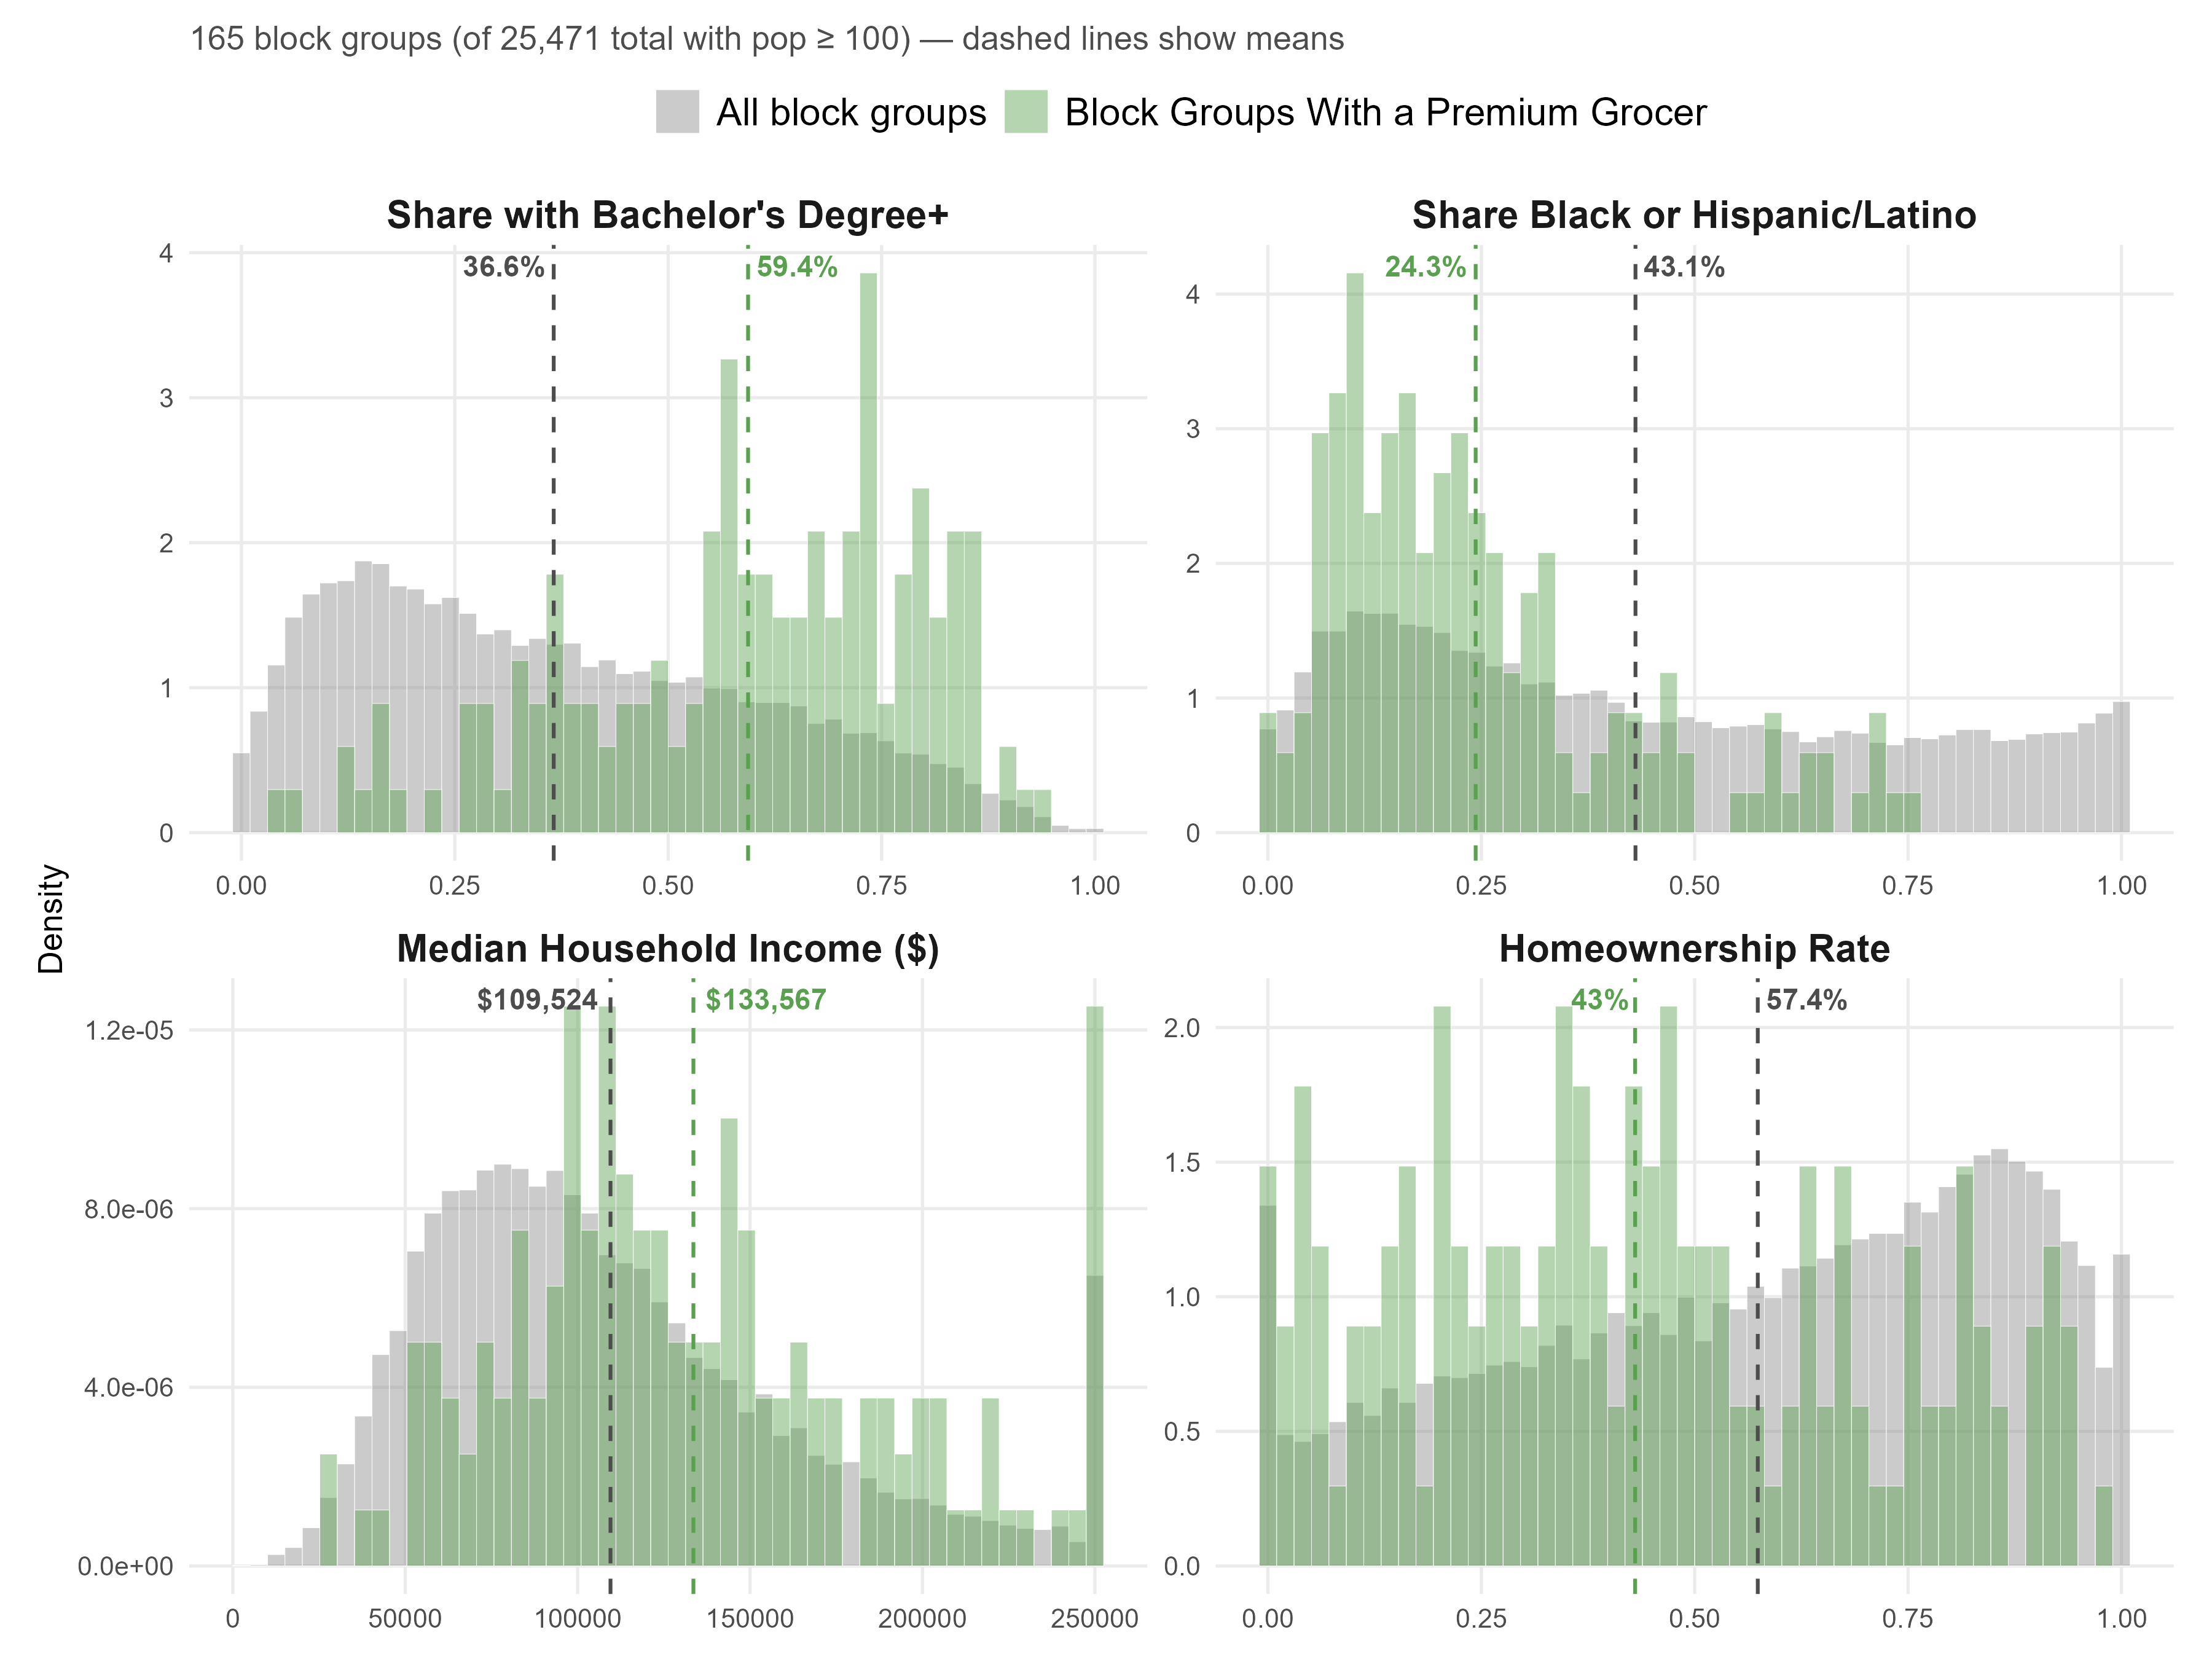
The figure below shows the distribution of demographic characteristics for census block groups containing at least one premium store. The dashed vertical lines represent average values across block groups.
Relative to state-wide averages across block groups, the locations with premium grocers have substantially higher shares of college-educated adults (on average, 59.4 p.p. vs 36.6 p.p), lower shares of Black and Hispanic/Latino residents (on average, 24.3 p.p. vs 43.1 p.p.), and elevated median household incomes (on average, $133.5k vs $109.5k). However, they also have substantially lower homeownership rates, about 43 p.p. on average, compared to the overall average of 57.4 p.p..
In summary, the locations of premium stores appear significantly skewed towards areas with high-education and high-income renters. Thus, premium stores’ micro-locations are a flag for locations with substantial demand for Class-A apartments and multifamily development.
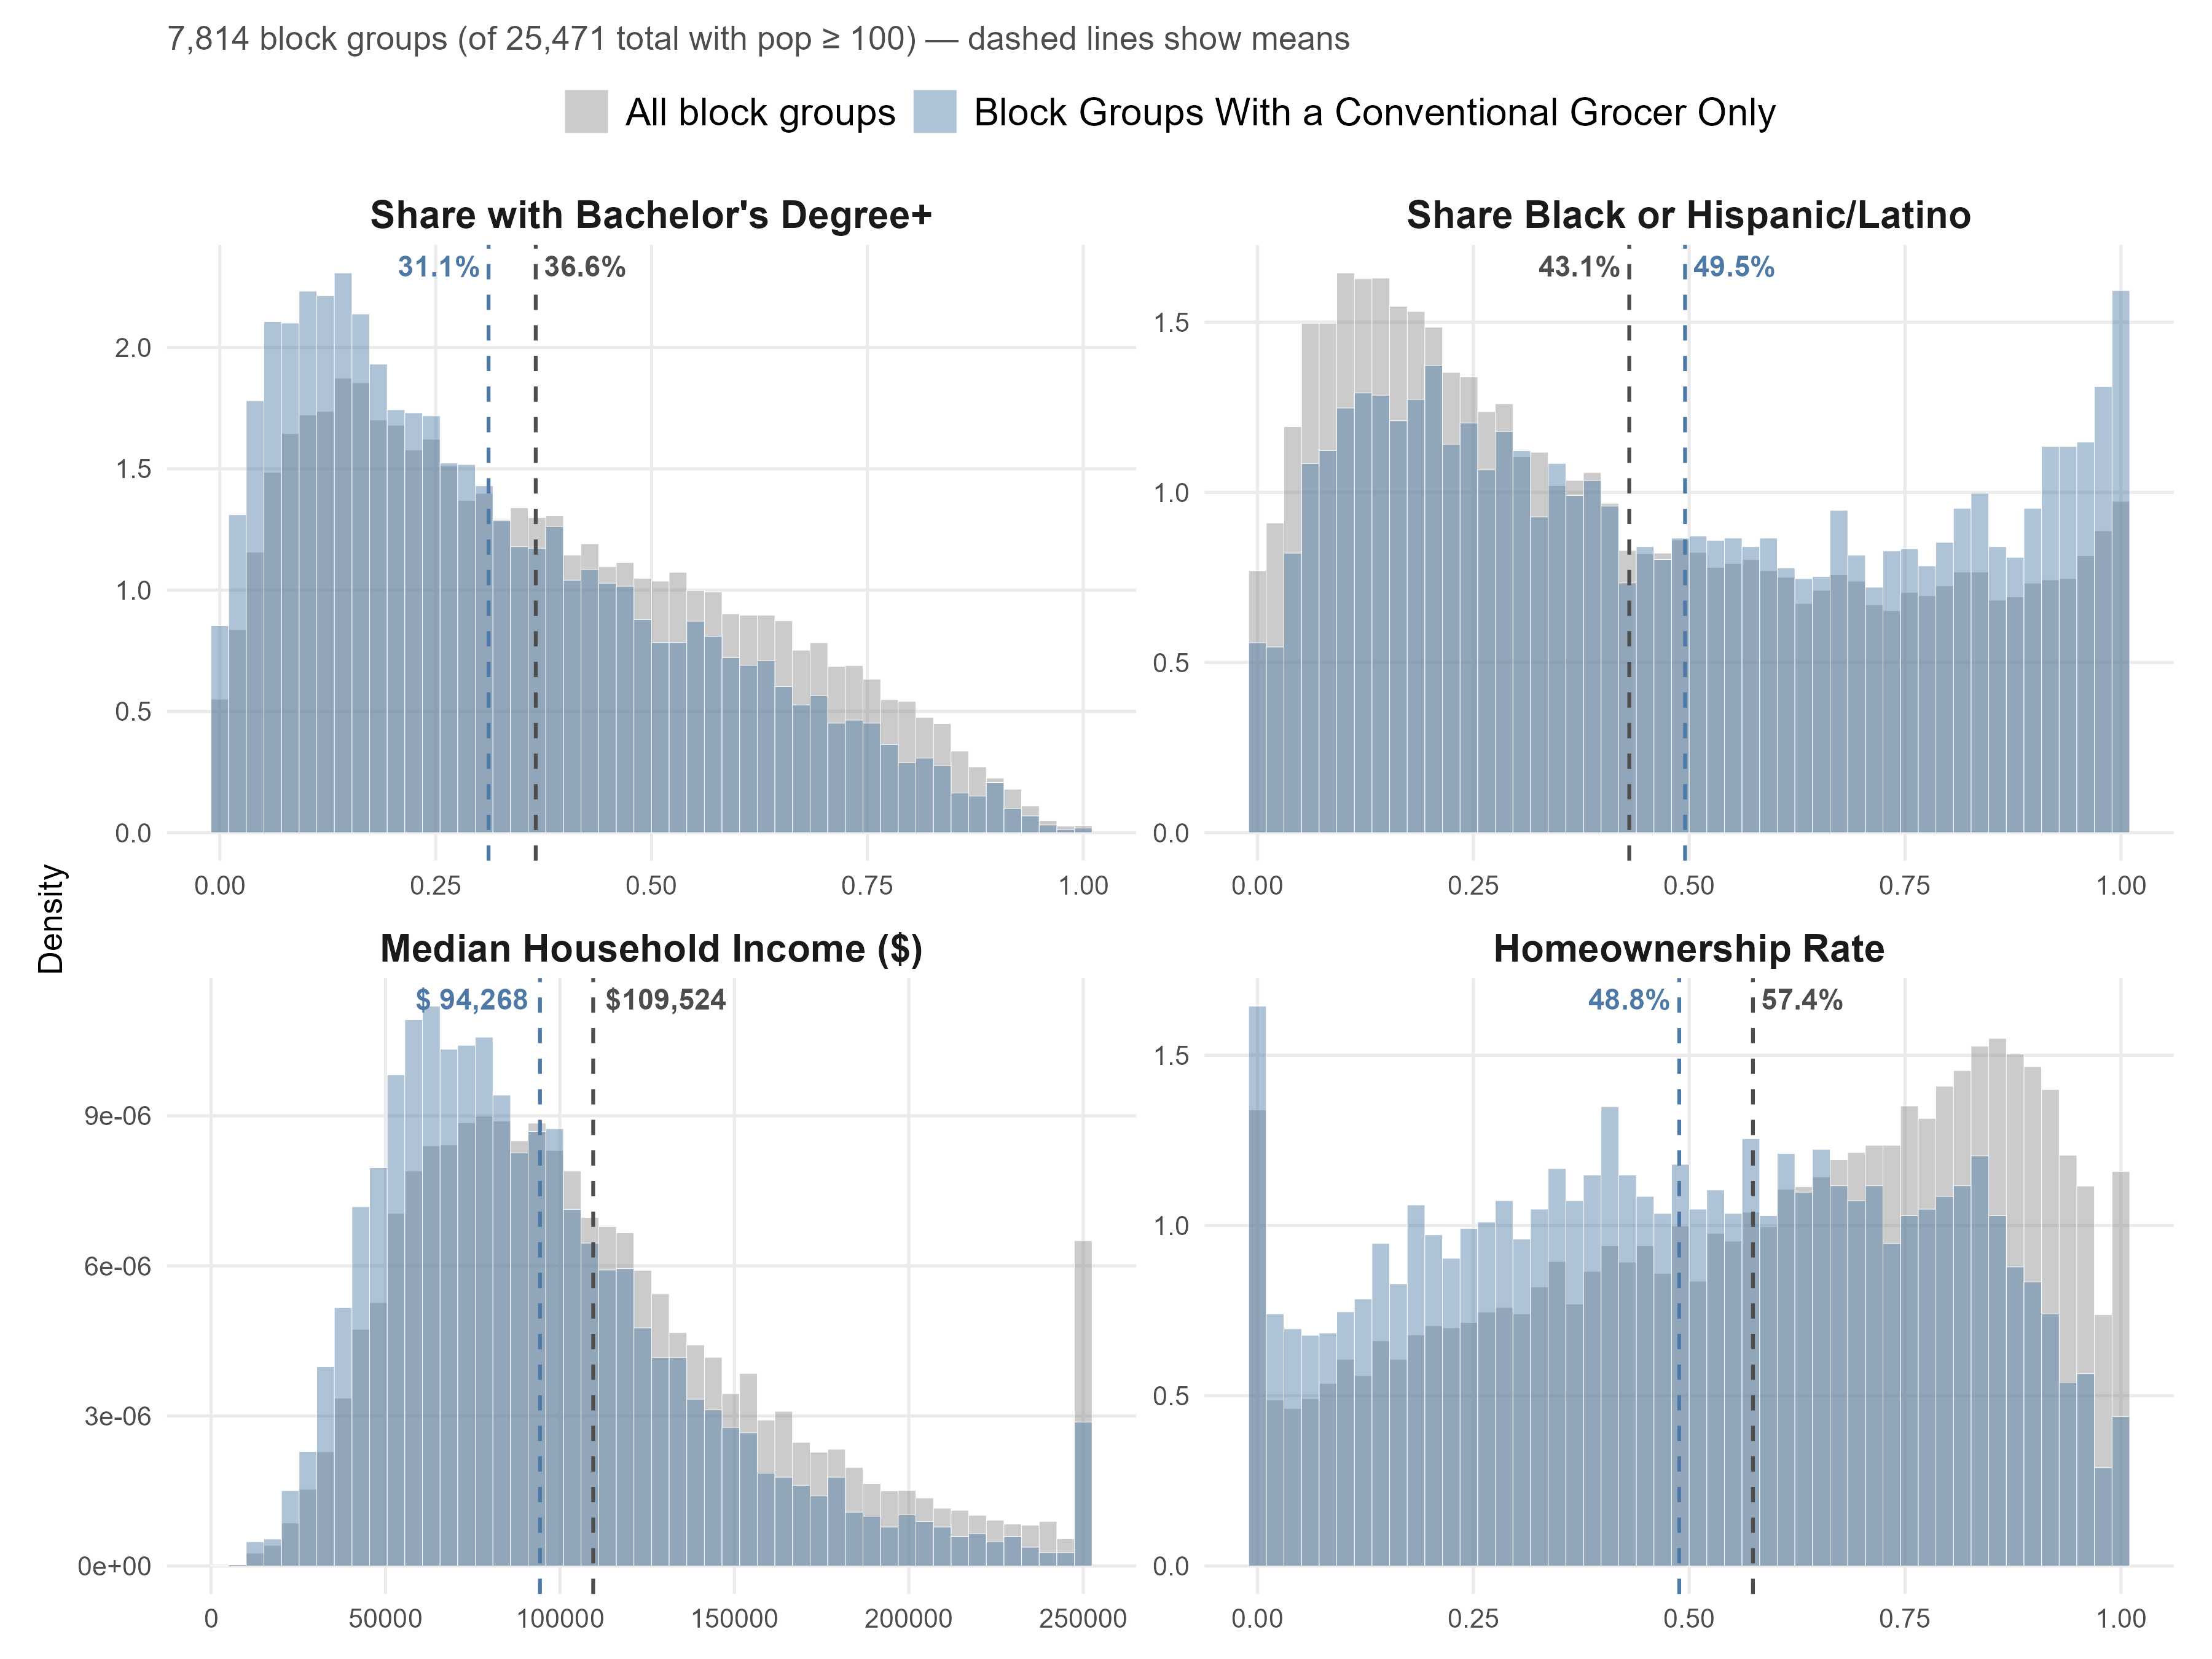
We can see below that conventional stores, by contrast, are located in block groups with a distribution of demographic characteristics more similar to the overall population of block groups, but with on average a lower share of bachelor educated adults (31.1 p.p., on average), lower incomes ($94.2k), a higher share of Black or Hispanic/Latino residents (49.5 p.p.), and lower homeownership rates (48.8 p.p.).
These gaps are particularly significant when compared to the premium stores, with a 30% relative difference in average income across locations, and a 28 p.p. gap in the average share of bachelor-educated population.
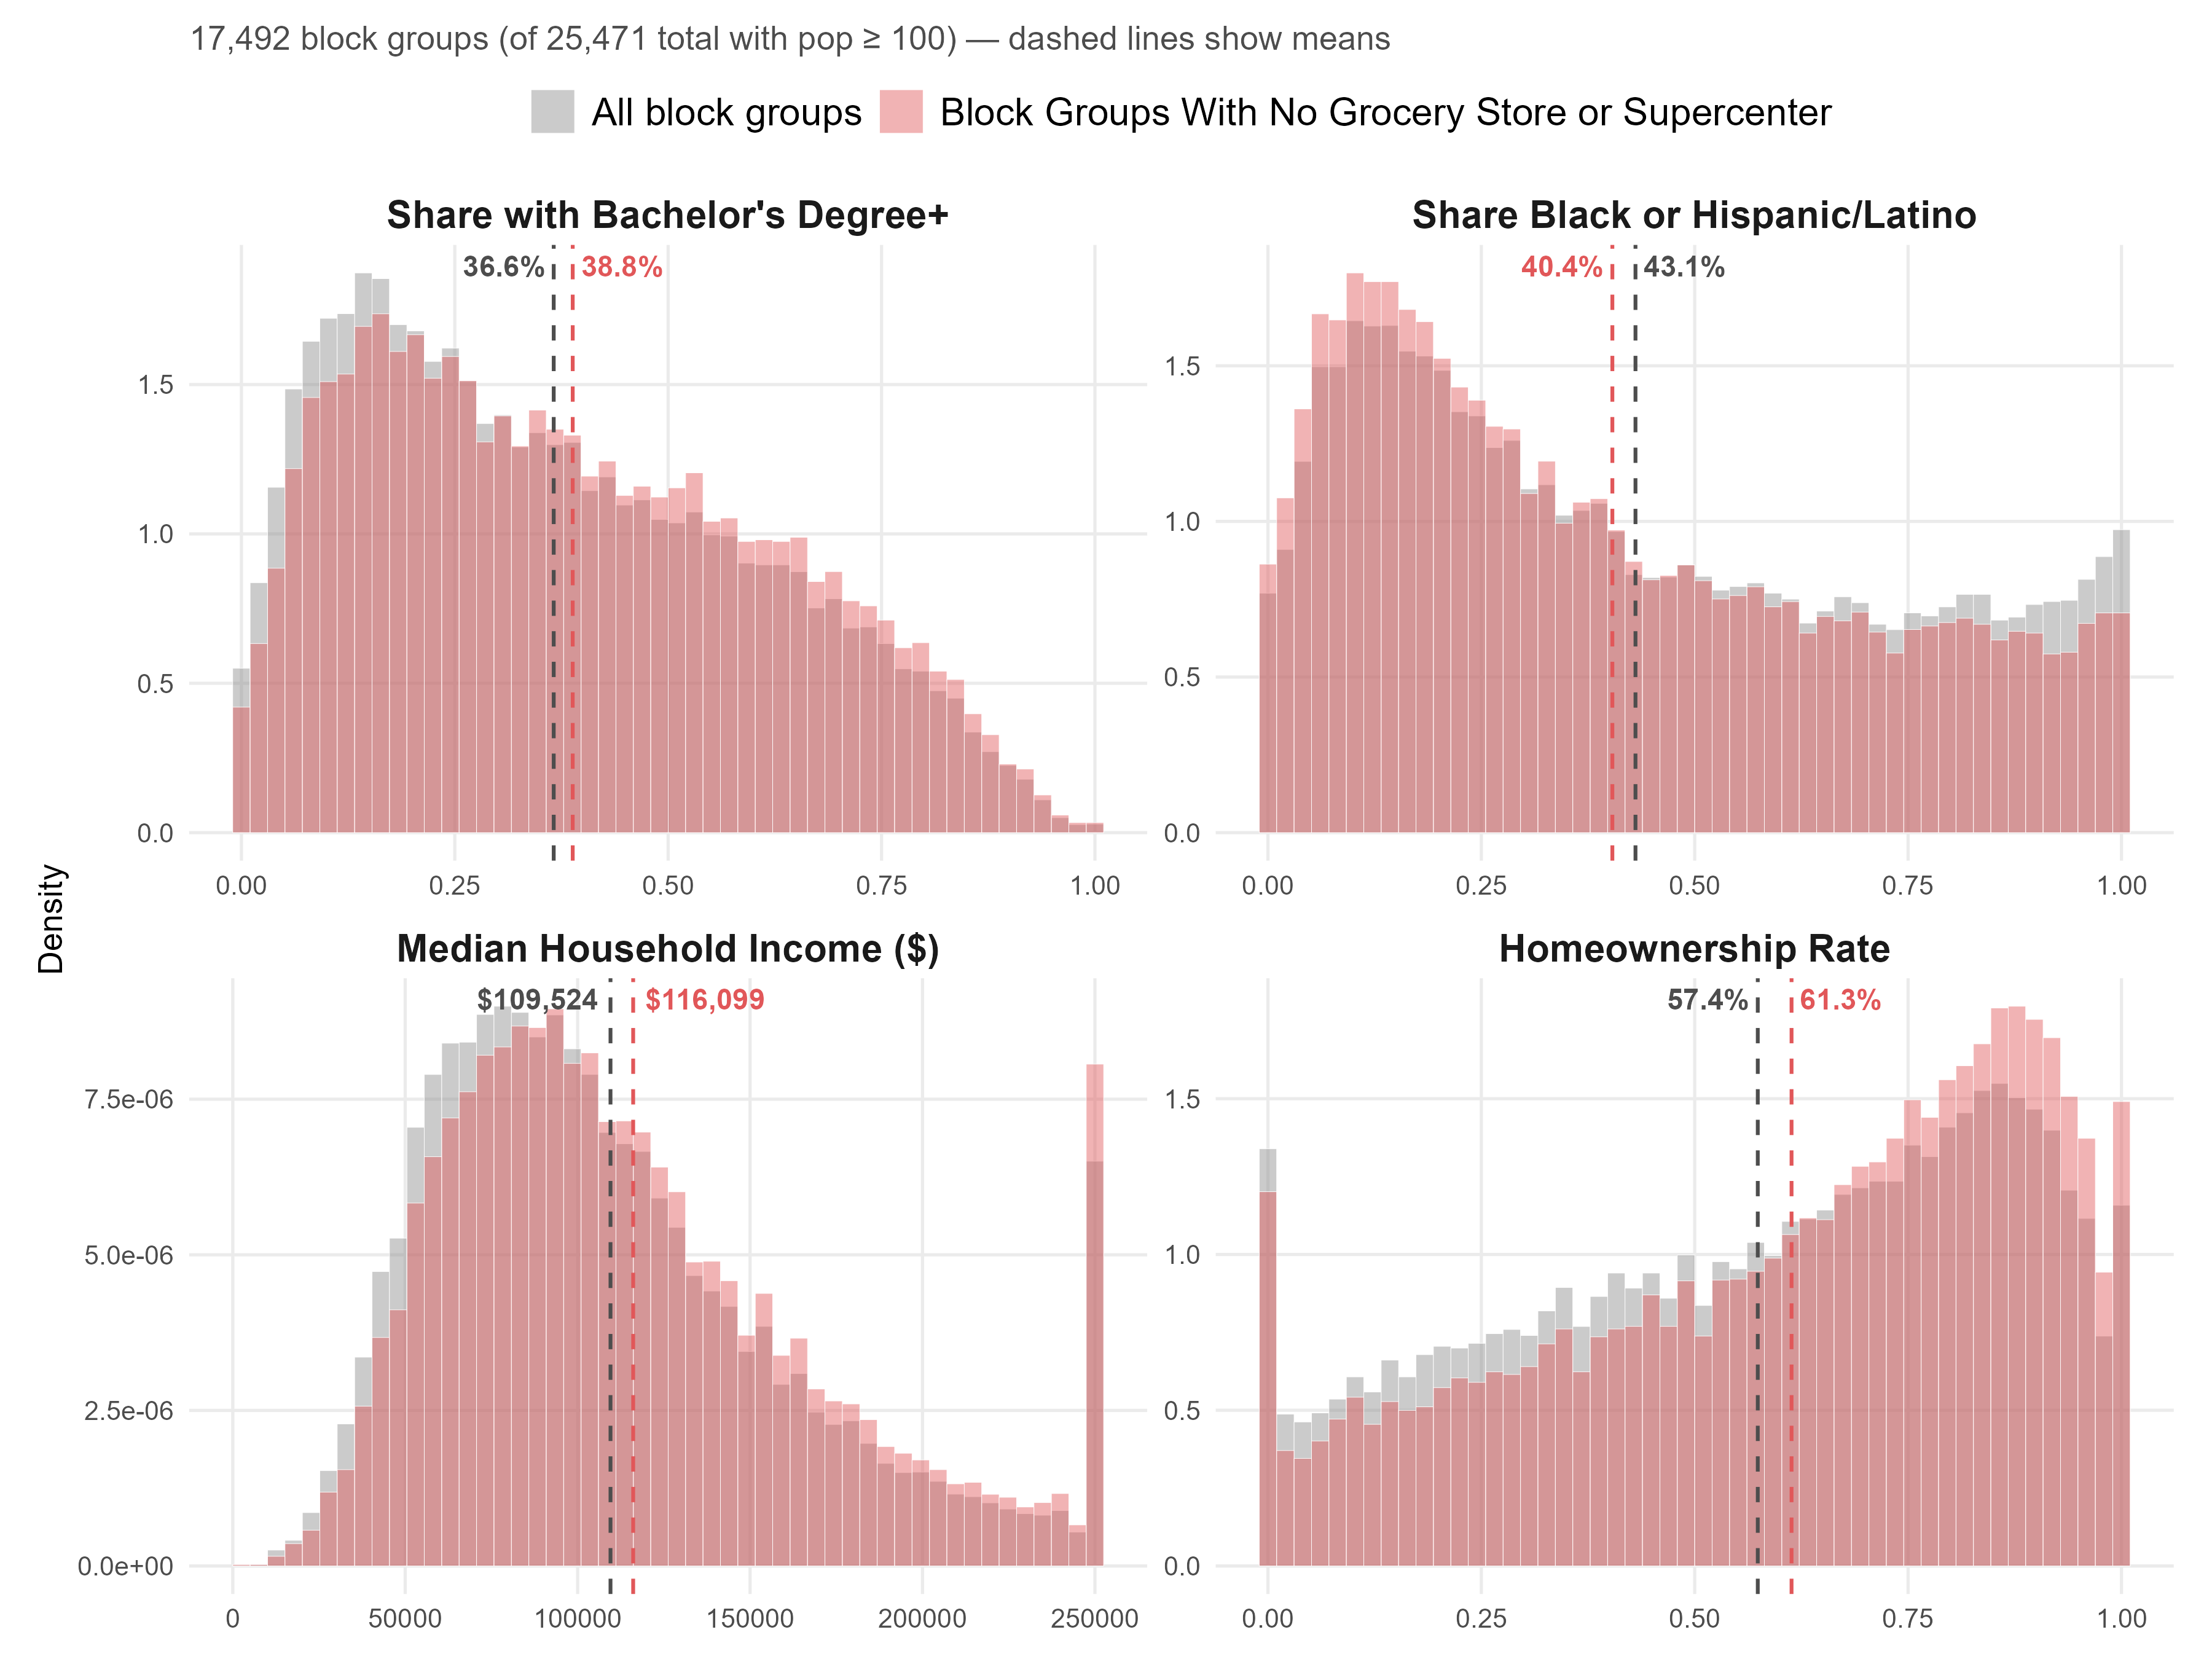
Notably, 68.7% of California’s block groups contain no grocery store or supercenter at all. These neighborhoods in principle include lower-density areas at the outskirts of major population centers. However, in the figure below, we find that these block groups without grocery stores have a distribution of demographic characteristics similar to the overall population; if anything, they have slightly higher education and income, a lower Black and Hispanic/Latino share, and a higher homeownership rate. Thus, residential neighborhoods are likely to make up a substantial portion of these areas.
Closure Rates and Their Spatial Distribution
Between 2019 and 2025, SafeGraph recorded 3,427 grocery store and supercenter closures in California. The closure rate (closed stores divided by closed plus open stores as of 2025) diverges sharply by store type: 20.5% for non-high-end stores, compared to 5.6% for high-end stores. This is a nearly four-to-one ratio.
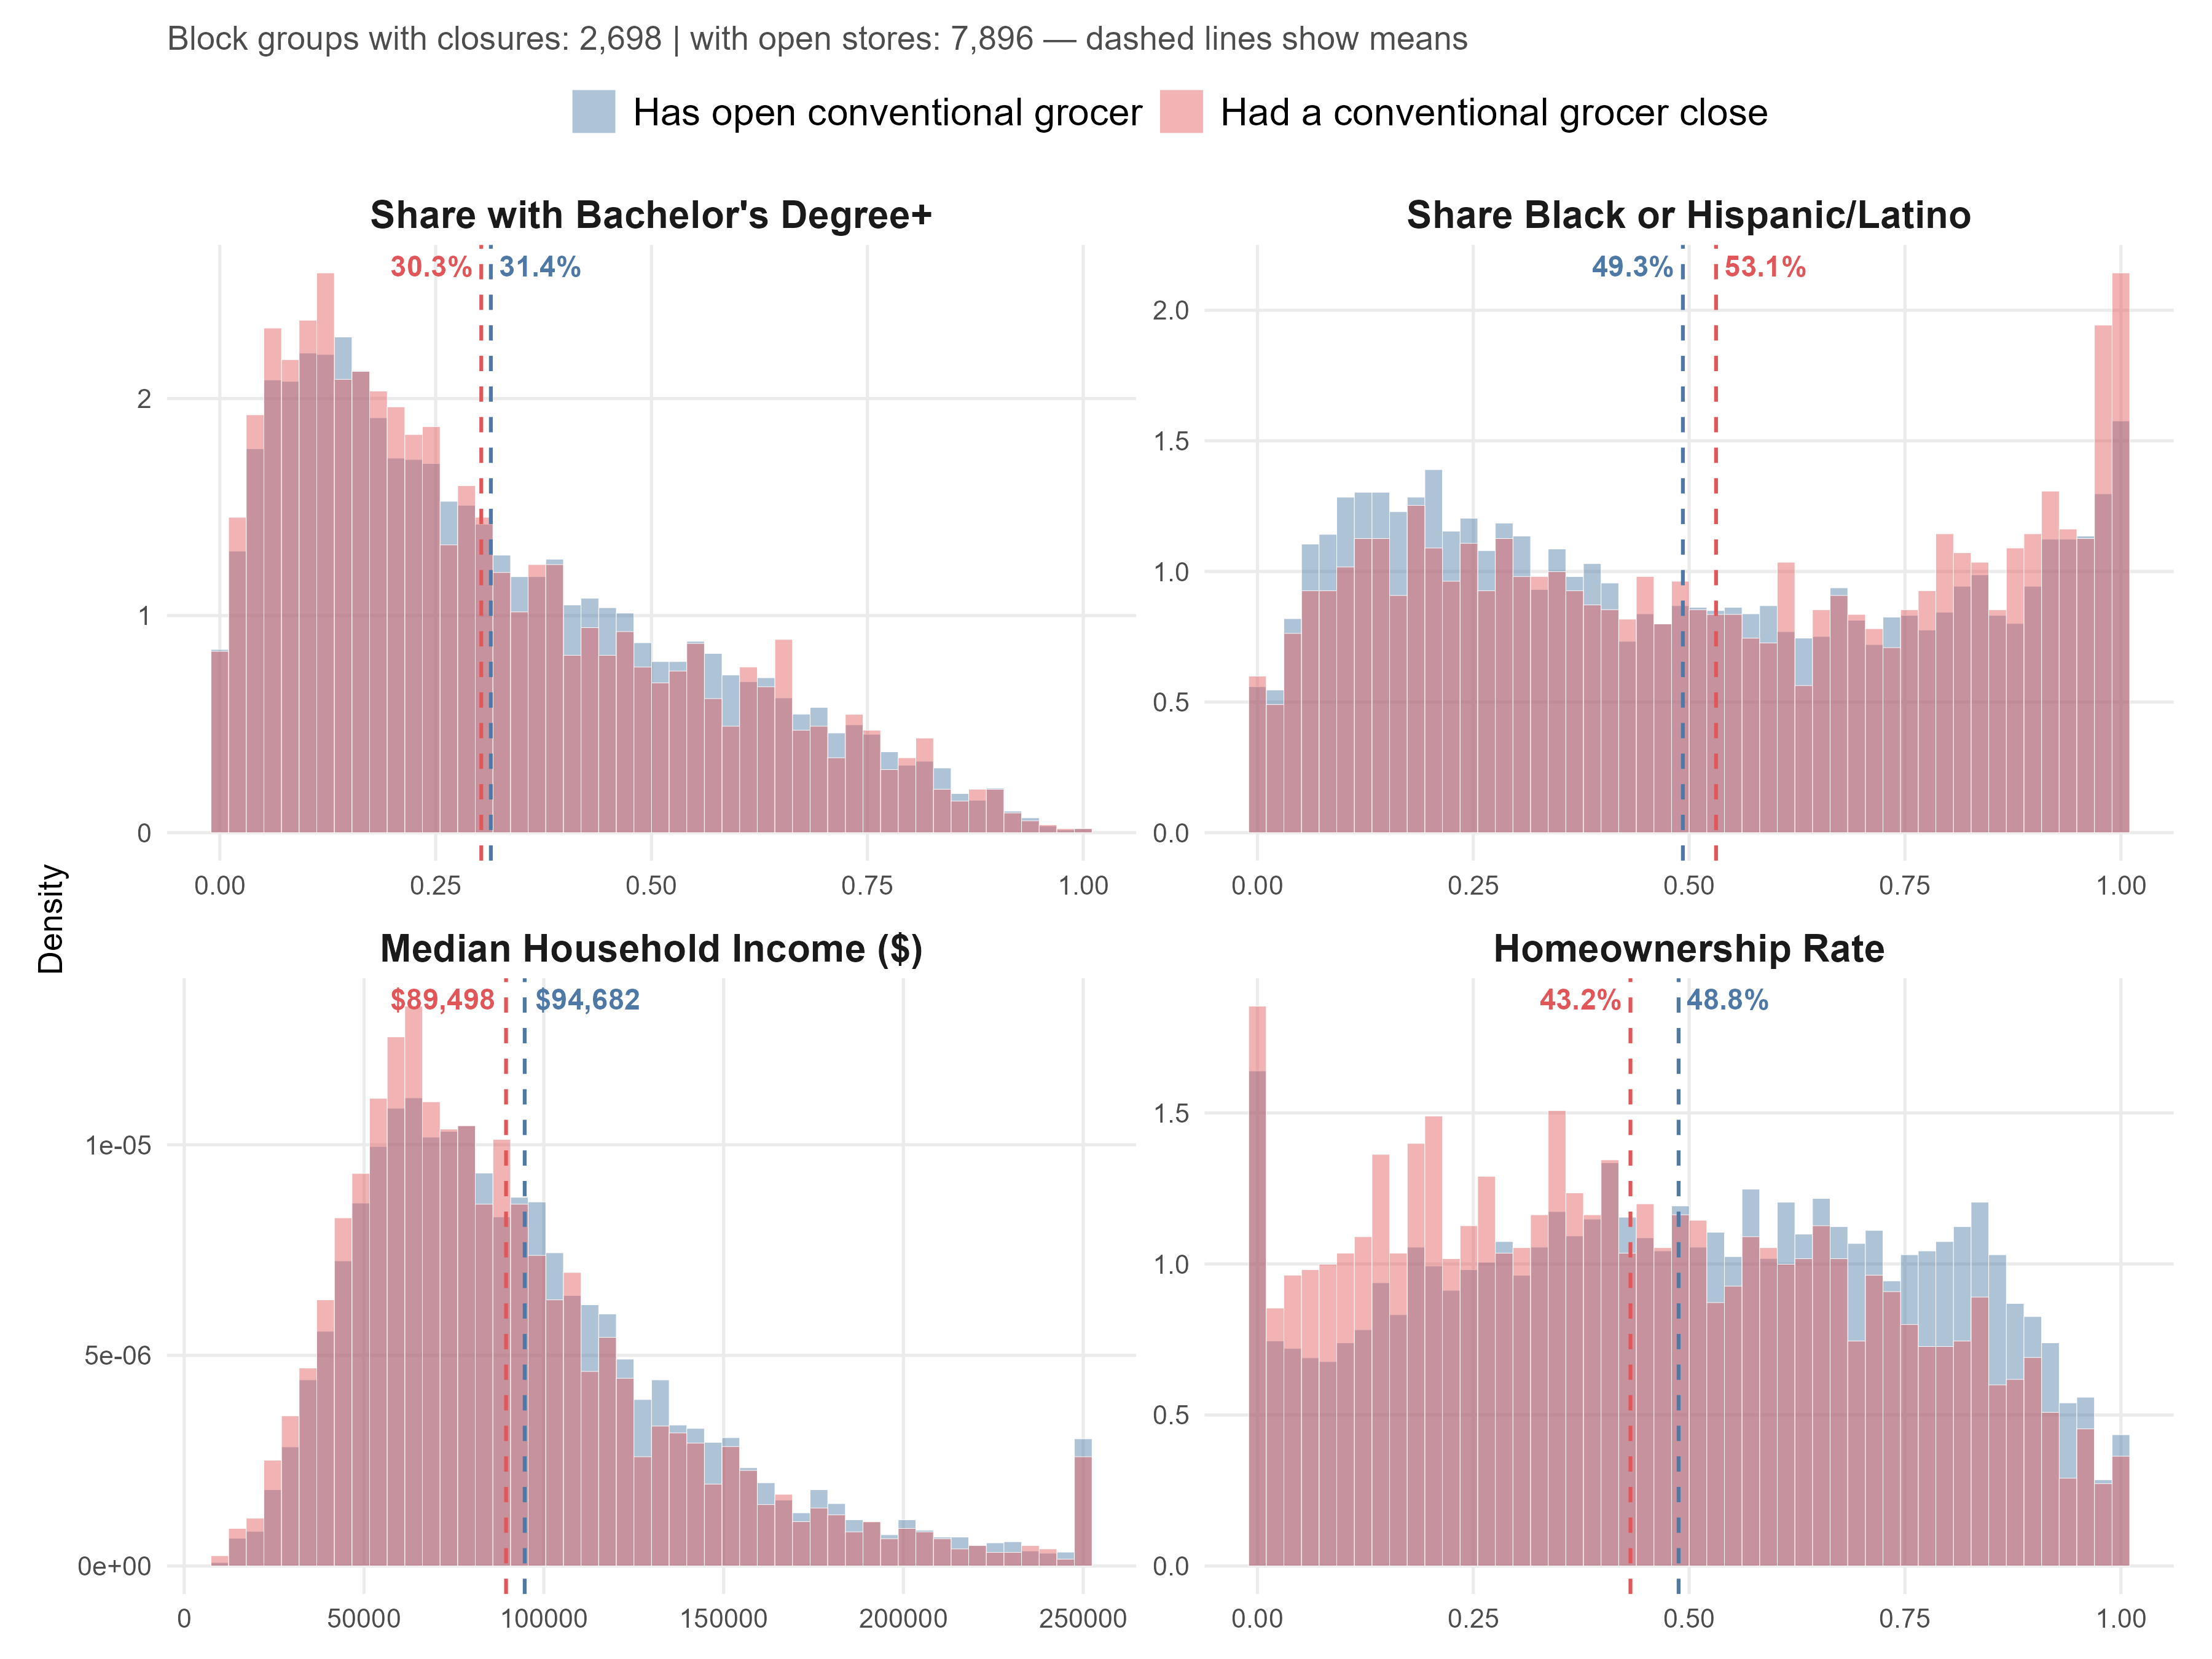
A comparison of block groups where conventional stores closed against those in which there were no closures reveals broadly similar demographic distributions. However, some differences are visible in average characteristics: compared to block groups with open stores, block groups experiencing closures tend to have slightly lower median incomes, somewhat higher shares of Black and Hispanic/Latino residents, and lower homeownership rates. These differences, while not dramatic, suggest a tilt toward more vulnerable communities.
In addition, block groups with conventional grocery stores already have lower incomes and educational attainment than the average block group in the state. Compared with the overall distribution of demographic characteristics across block groups in California, block groups affected by store closures tend to have incomes nearly 20% lower, a share of bachelor's degree holders more than 6 p.p. lower, a Black and Hispanic/Latino population share 10 p.p. higher, and homeownership rates 14 p.p. lower.
Geographic Concentration of Closures: Los Angeles County
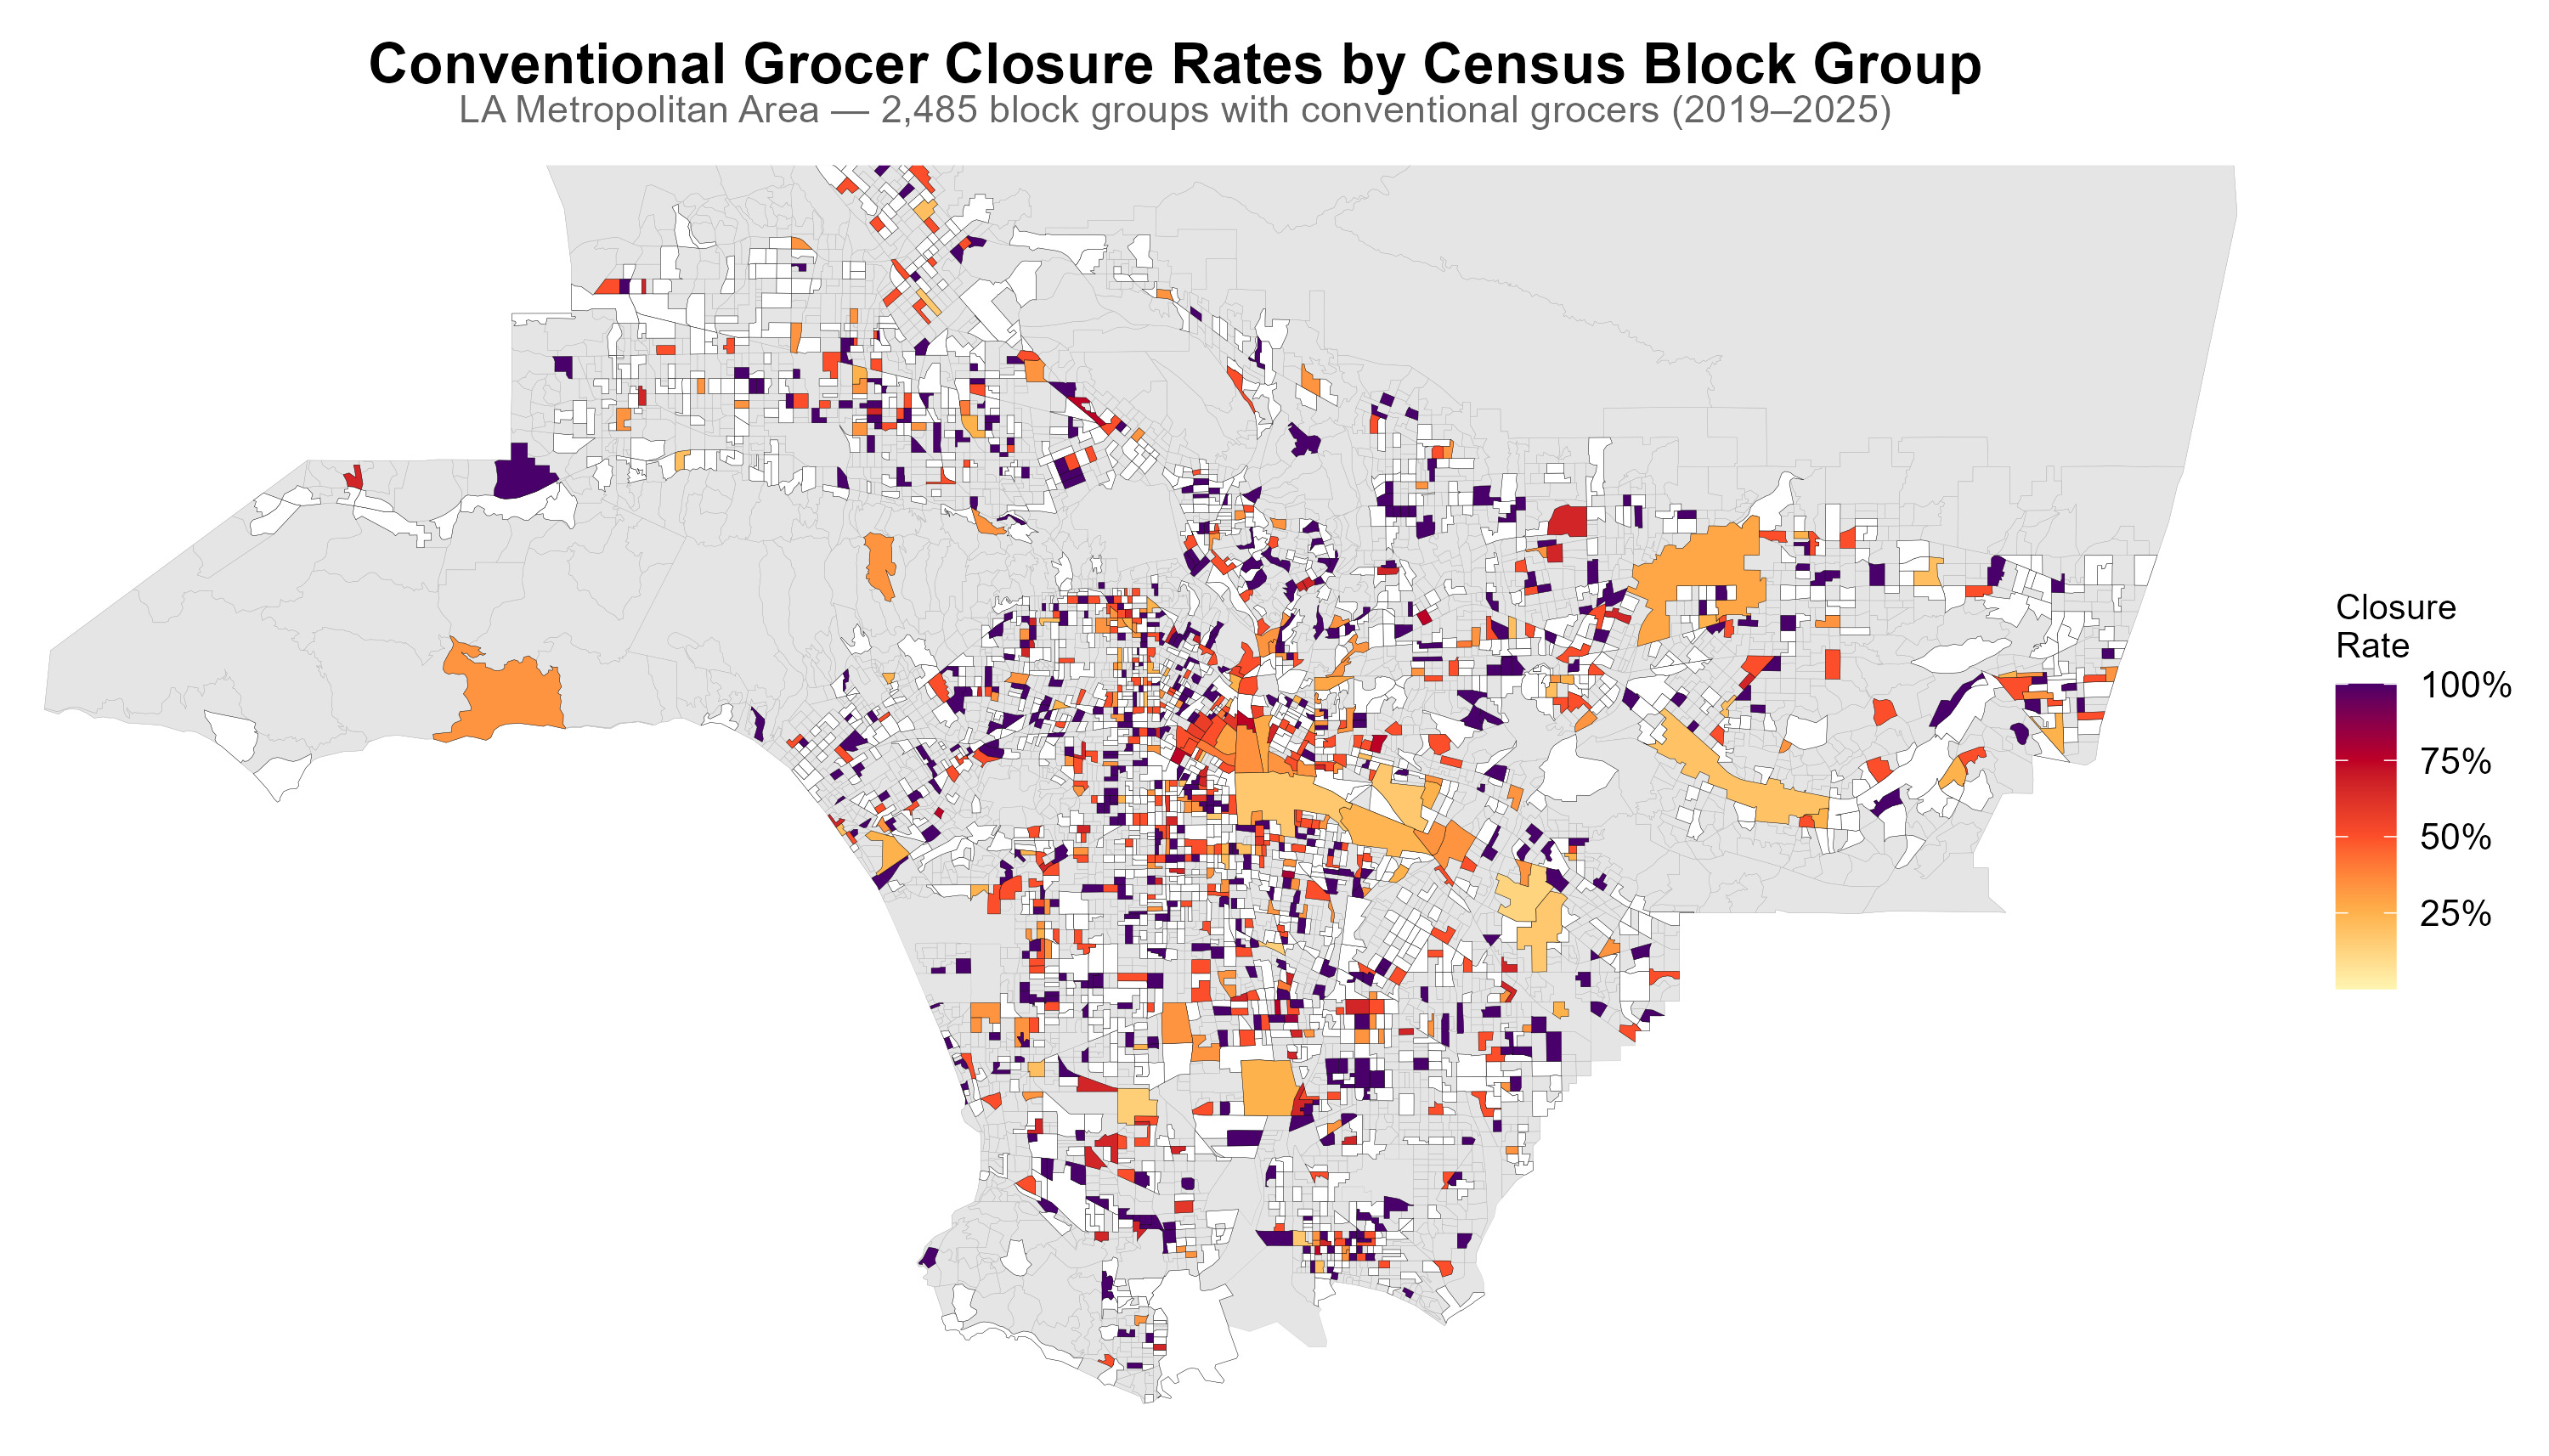
Another important aspect of closures is that they are spatially concentrated. We illustrate this point below, with a figure focusing on the main metropolitan area of Los Angeles County.
We show areas with no conventional grocery stores in gray, areas with stores and no closures over the period between 2019 and 2025 in white. Then, block groups experiencing closures are color-coded, with a darker color corresponding to higher closure rates (closed stores divided by closed plus open stores as of 2025). We can see that many block groups experiencing closures lose all or more than half of their stores, and that closures cluster across neighboring block groups, especially close to downtown Los Angeles, in the East, and in the South.
Conclusion
Grocery stores are crucial neighborhood amenities that provide local residents with access to food and other products. While evidence of assortative matching between local socioeconomic characteristics and the likelihood of having access to premium stores is to be expected, it is still striking how strong this phenomenon is in the data. Moreover, it is interesting that conventional grocery stores tend to be located in neighborhoods with lower incomes and educational attainment. Finally, the scale and concentration of conventional store closures are concerning trends. Based on our results, store closures may, over time, worsen access to supermarkets for lower-income areas.