
The Fuel Cost Burden of Commuting to Work
How much do American households spend on fuel just to get to work? A census block group-level analysis of the four largest U.S. metros.

The United States is largely a car-dependent nation. This implies that gasoline prices directly affect household budgets. Oil prices are inherently volatile. In 2022, the national average for regular gasoline briefly topped $5 per gallon before retreating to around $3.30 by 2024.
Fuel price swings hit household budgets, particularly for families in car-dependent suburbs who face long daily commutes. While public transportation fares are also tied to fuel costs, they tend to be lower overall and adjust more gradually, offering commuters greater short-term stability. Car commuters, by contrast, feel every price spike immediately and directly.
We present here a census block group-level analysis of commuting fuel costs based on data from the American Community Survey and the Bureau of Labor Statistics. We focus on the broader commuting zones of the four most populous U.S. metropolitan areas: Los Angeles, Chicago, New York, and Dallas. The analysis is conducted at the census block group level because it is the finest geographic resolution at which the data are published. Each block group typically covers 600 to 3,000 people.
In recent weeks, conflict, geopolitical tensions, and disruptions to crude oil flows from the Middle East have led to higher prices at the pump and uncertainty about future price growth. Our calculations are based on fuel prices in February 2026 (the latest data available from the Bureau of Labor Statistics), before the beginning of the conflict in the Middle East, and likely represent a lower bound for projections of commuting fuel costs in the coming months.
Key takeaways from our study:
New York stands apart from the other three major metropolitan areas. Its extensive transit network fundamentally reshapes commuting patterns, reducing reliance on private vehicles.
In Dallas, Los Angeles, and Chicago, car is the main mode of commute in a large share of neighborhoods. Census block groups in which more than 80% of workers use a car as the main commute mode account for 60% of all block groups in Dallas, 47% in Los Angeles, and 43% in Chicago. New York still has a significant share of 20%, but much lower than the other three metros.
Costs are significant, even though fuel prices were not at historically high levels in February 2026. Moreover, there are very large differences across metropolitan areas. Los Angeles has by far the highest car commuting cost. The median commuting fuel cost across block groups is at $26.24 per household per week, compared to slightly more than $16 in Chicago and Dallas, and just $10.23 in New York. Restricting the sample to car-owning households raises the Los Angeles median to $28.16 per week, while New York remains the lowest-cost city at $12.85 per week. This is striking because fuel prices in New York and Chicago are similar. However, New York benefits from shorter commutes and lower car usage.
Interestingly, costs tend to follow an inverted U-shaped pattern in census block group-level household income within each metro. Thus, middle-income households experience the highest car commuting costs. The pattern is present both when considering all households and car-owning households only and highlights that households in middle-income blocks are, in general, the most reliant on their cars.
Data Sources and Methodology
This section provides a detailed discussion of our data sources and assumptions. If you are only interested in the results, you can skip to the next section.
Our estimates are based on three primary data sources:
American Community Survey (ACS) 2019–2023, 5-year estimates: We use published summary tables at the census block group level. Key tables include B08134 (travel time by mode of transportation), B08301 (means of transportation to work), and B25044 (tenure by vehicles available).
Bureau of Labor Statistics (BLS) gasoline price series: We use the monthly average prices for regular unleaded gasoline by metro area (CPI Average Price data, series APU) for February 2026 (before the start of the war in the Middle East).
EPA and FHWA fleet efficiency data: We use a national average fuel economy of approximately 25.4 miles per gallon, reflecting the current light-duty vehicle fleet.
For each block group, we observe the number of car commuters, the average one-way commute time (estimated from ACS travel-time bins specific to car/truck/van commuters), and a metro-specific average commute speed. From these, we derive the one-way commute distance, compute daily and weekly fuel consumption at the fleet average miles per gallon, and multiply by the local gasoline price. We calculate total commuting fuel cost per census block group per week, and divide by the number of households, or by the number of households who own a car.
An important assumption: we use binned travel-time estimates from table B08134, which provides commute-time distributions specifically for car, truck, and van commuters. This avoids the bias that would arise from using the all-modes travel time distribution (which includes transit riders with systematically different commute times). The trade-off is that binned data introduces a midpoint approximation, but coverage at the block group level is nearly complete.
The Geography of Car Commuting
The maps below show the share of workers who commute by car, truck, or van in the commuting zones of our four metropolitan areas. As expected, car dependence is highest in suburban and extra-urban areas and lowest in dense urban cores with transit access. Yet, especially in the commuting zones of Los Angeles, Chicago, and Dallas, the share of workers commuting by car is remarkably high.
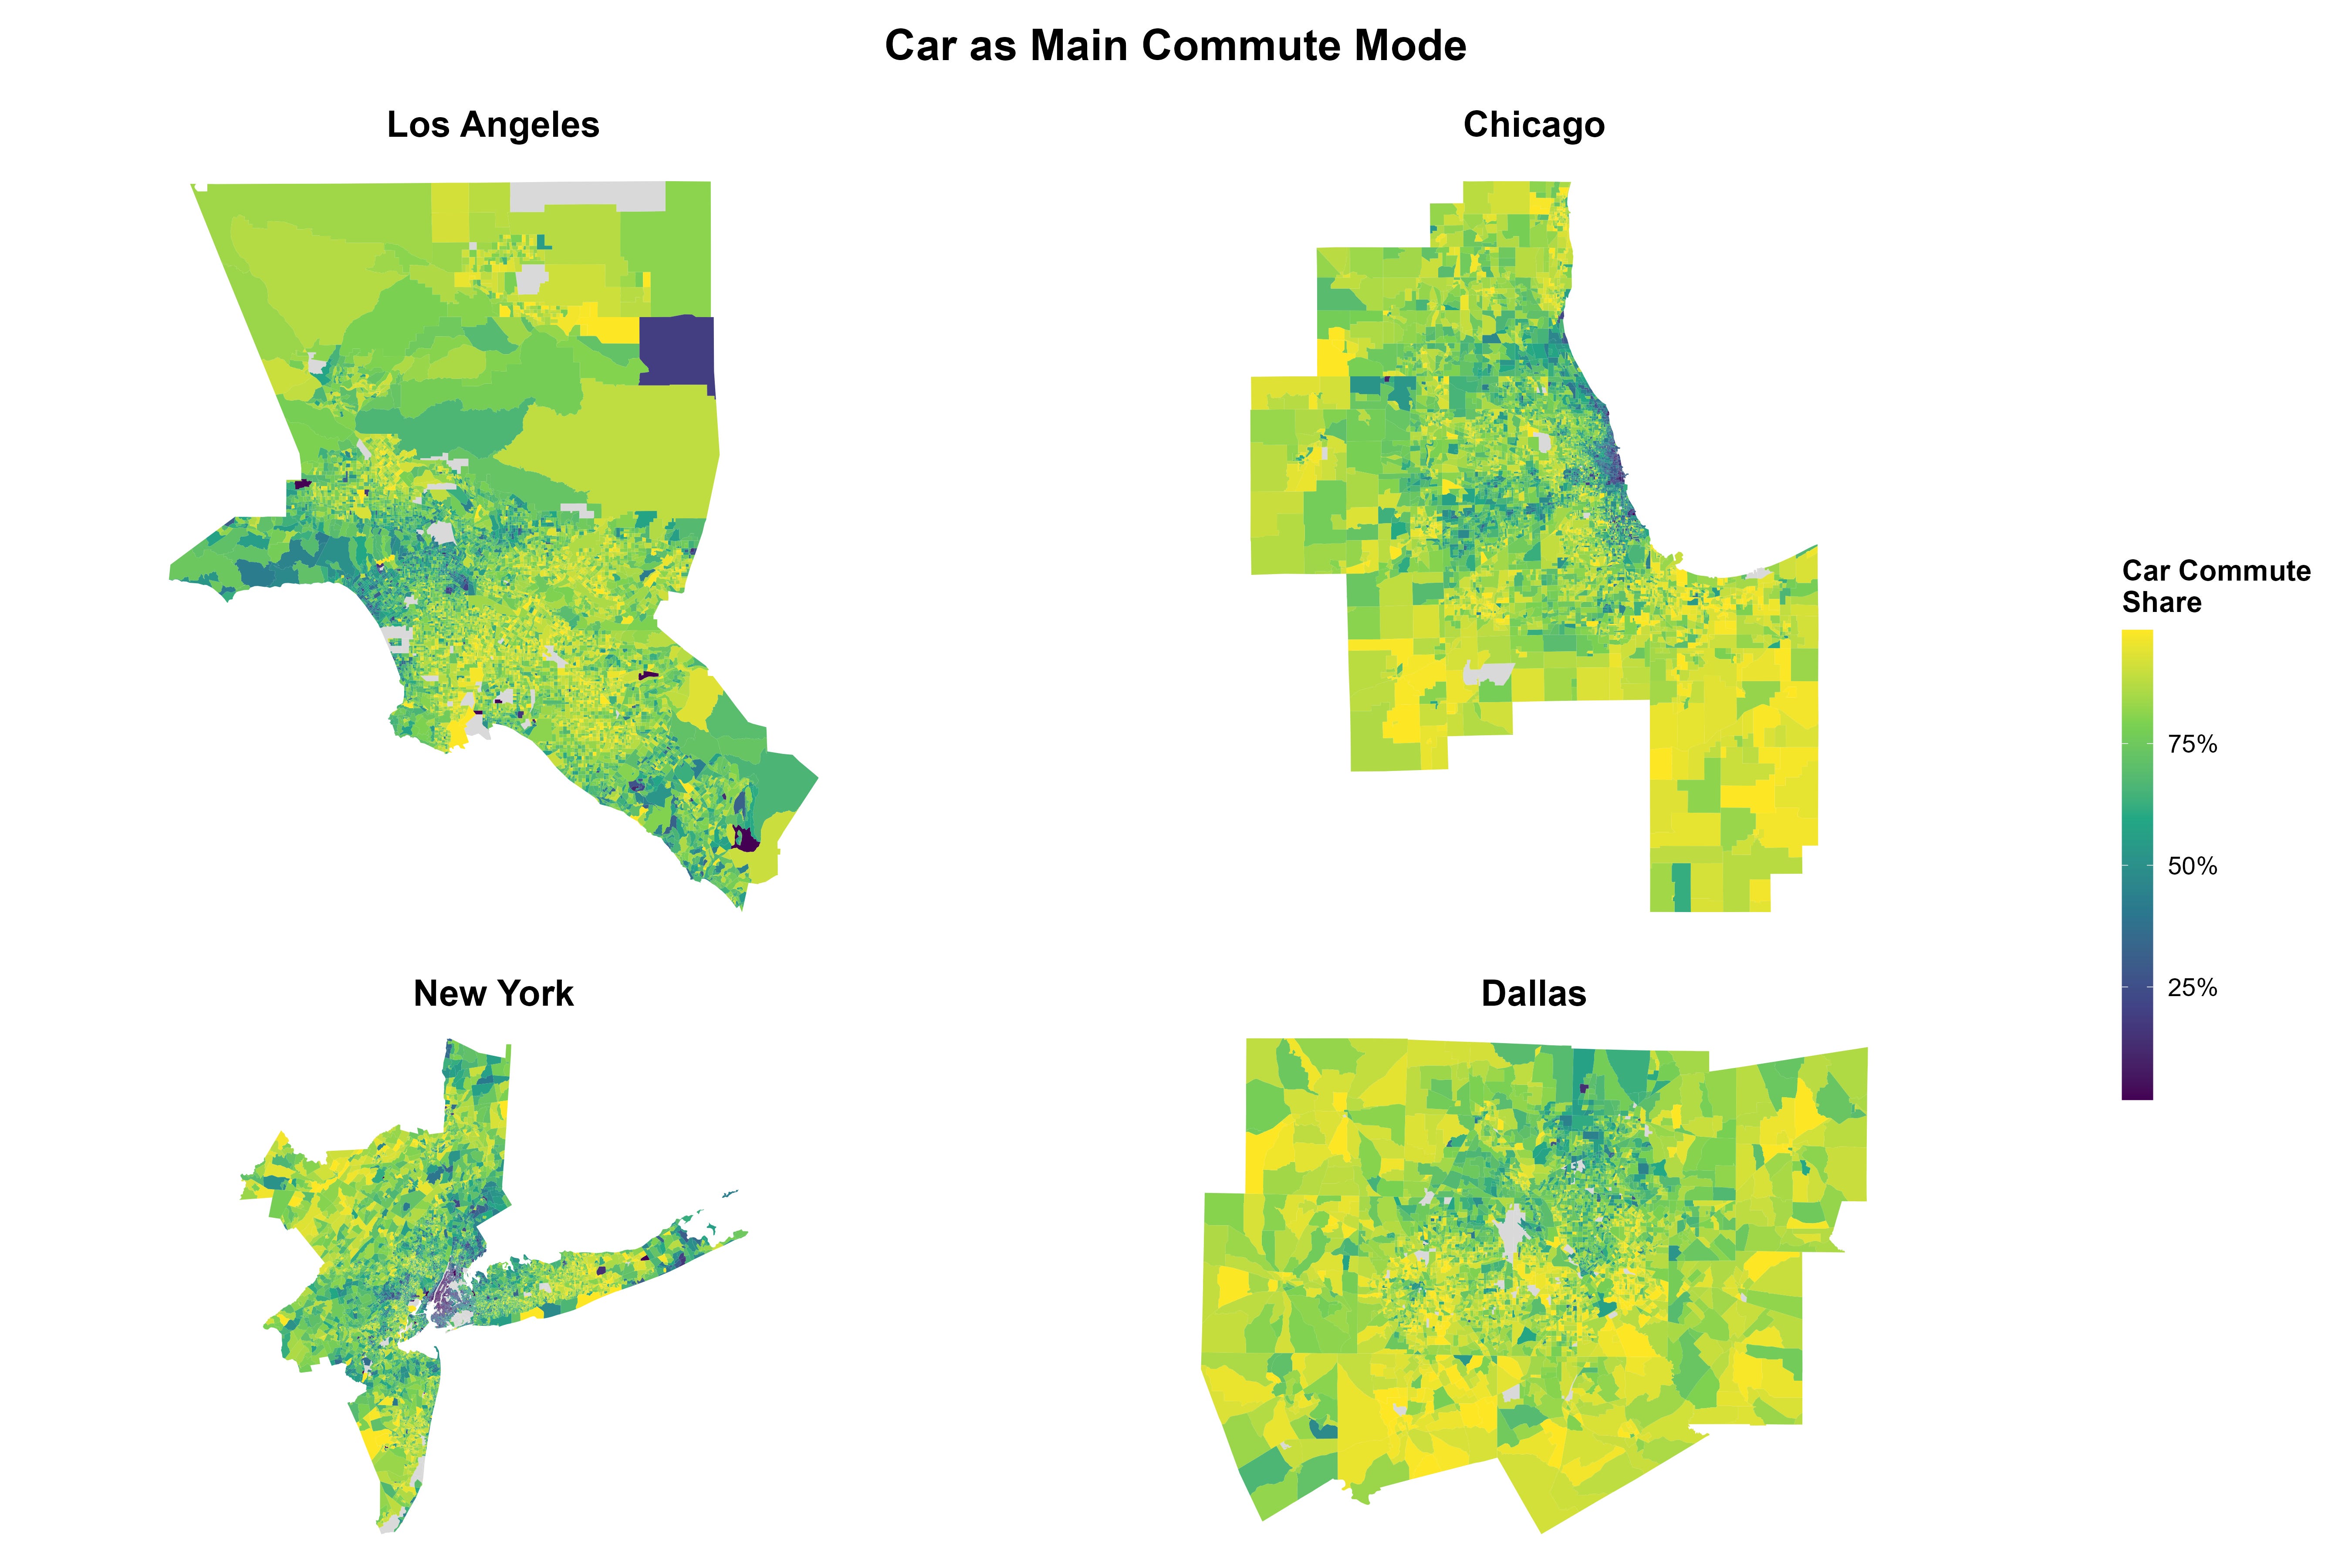
In Dallas, car commute shares are uniformly high, exceeding 80 percent in the majority (nearly 60%) of block groups. Los Angeles and Chicago show more variation, with lower car shares in downtown cores where transit is viable. Still, 47% (in Los Angeles), and 43.3% (in Chicago) of block groups have more than 80% of workers commuting by car.
New York stands apart: the five boroughs of New York City, particularly Manhattan and Brooklyn, have car commute shares below 30 percent, while the surrounding suburbs in New Jersey, Long Island, and Connecticut are as car-dependent as the other three metros. Overall, only 20% of block groups have more than 80% of workers who mainly commute by car.
Commuting Fuel Costs: Distribution
The histogram below shows the distribution of estimated weekly household fuel costs across block groups in each metro. The dashed red line marks the median.
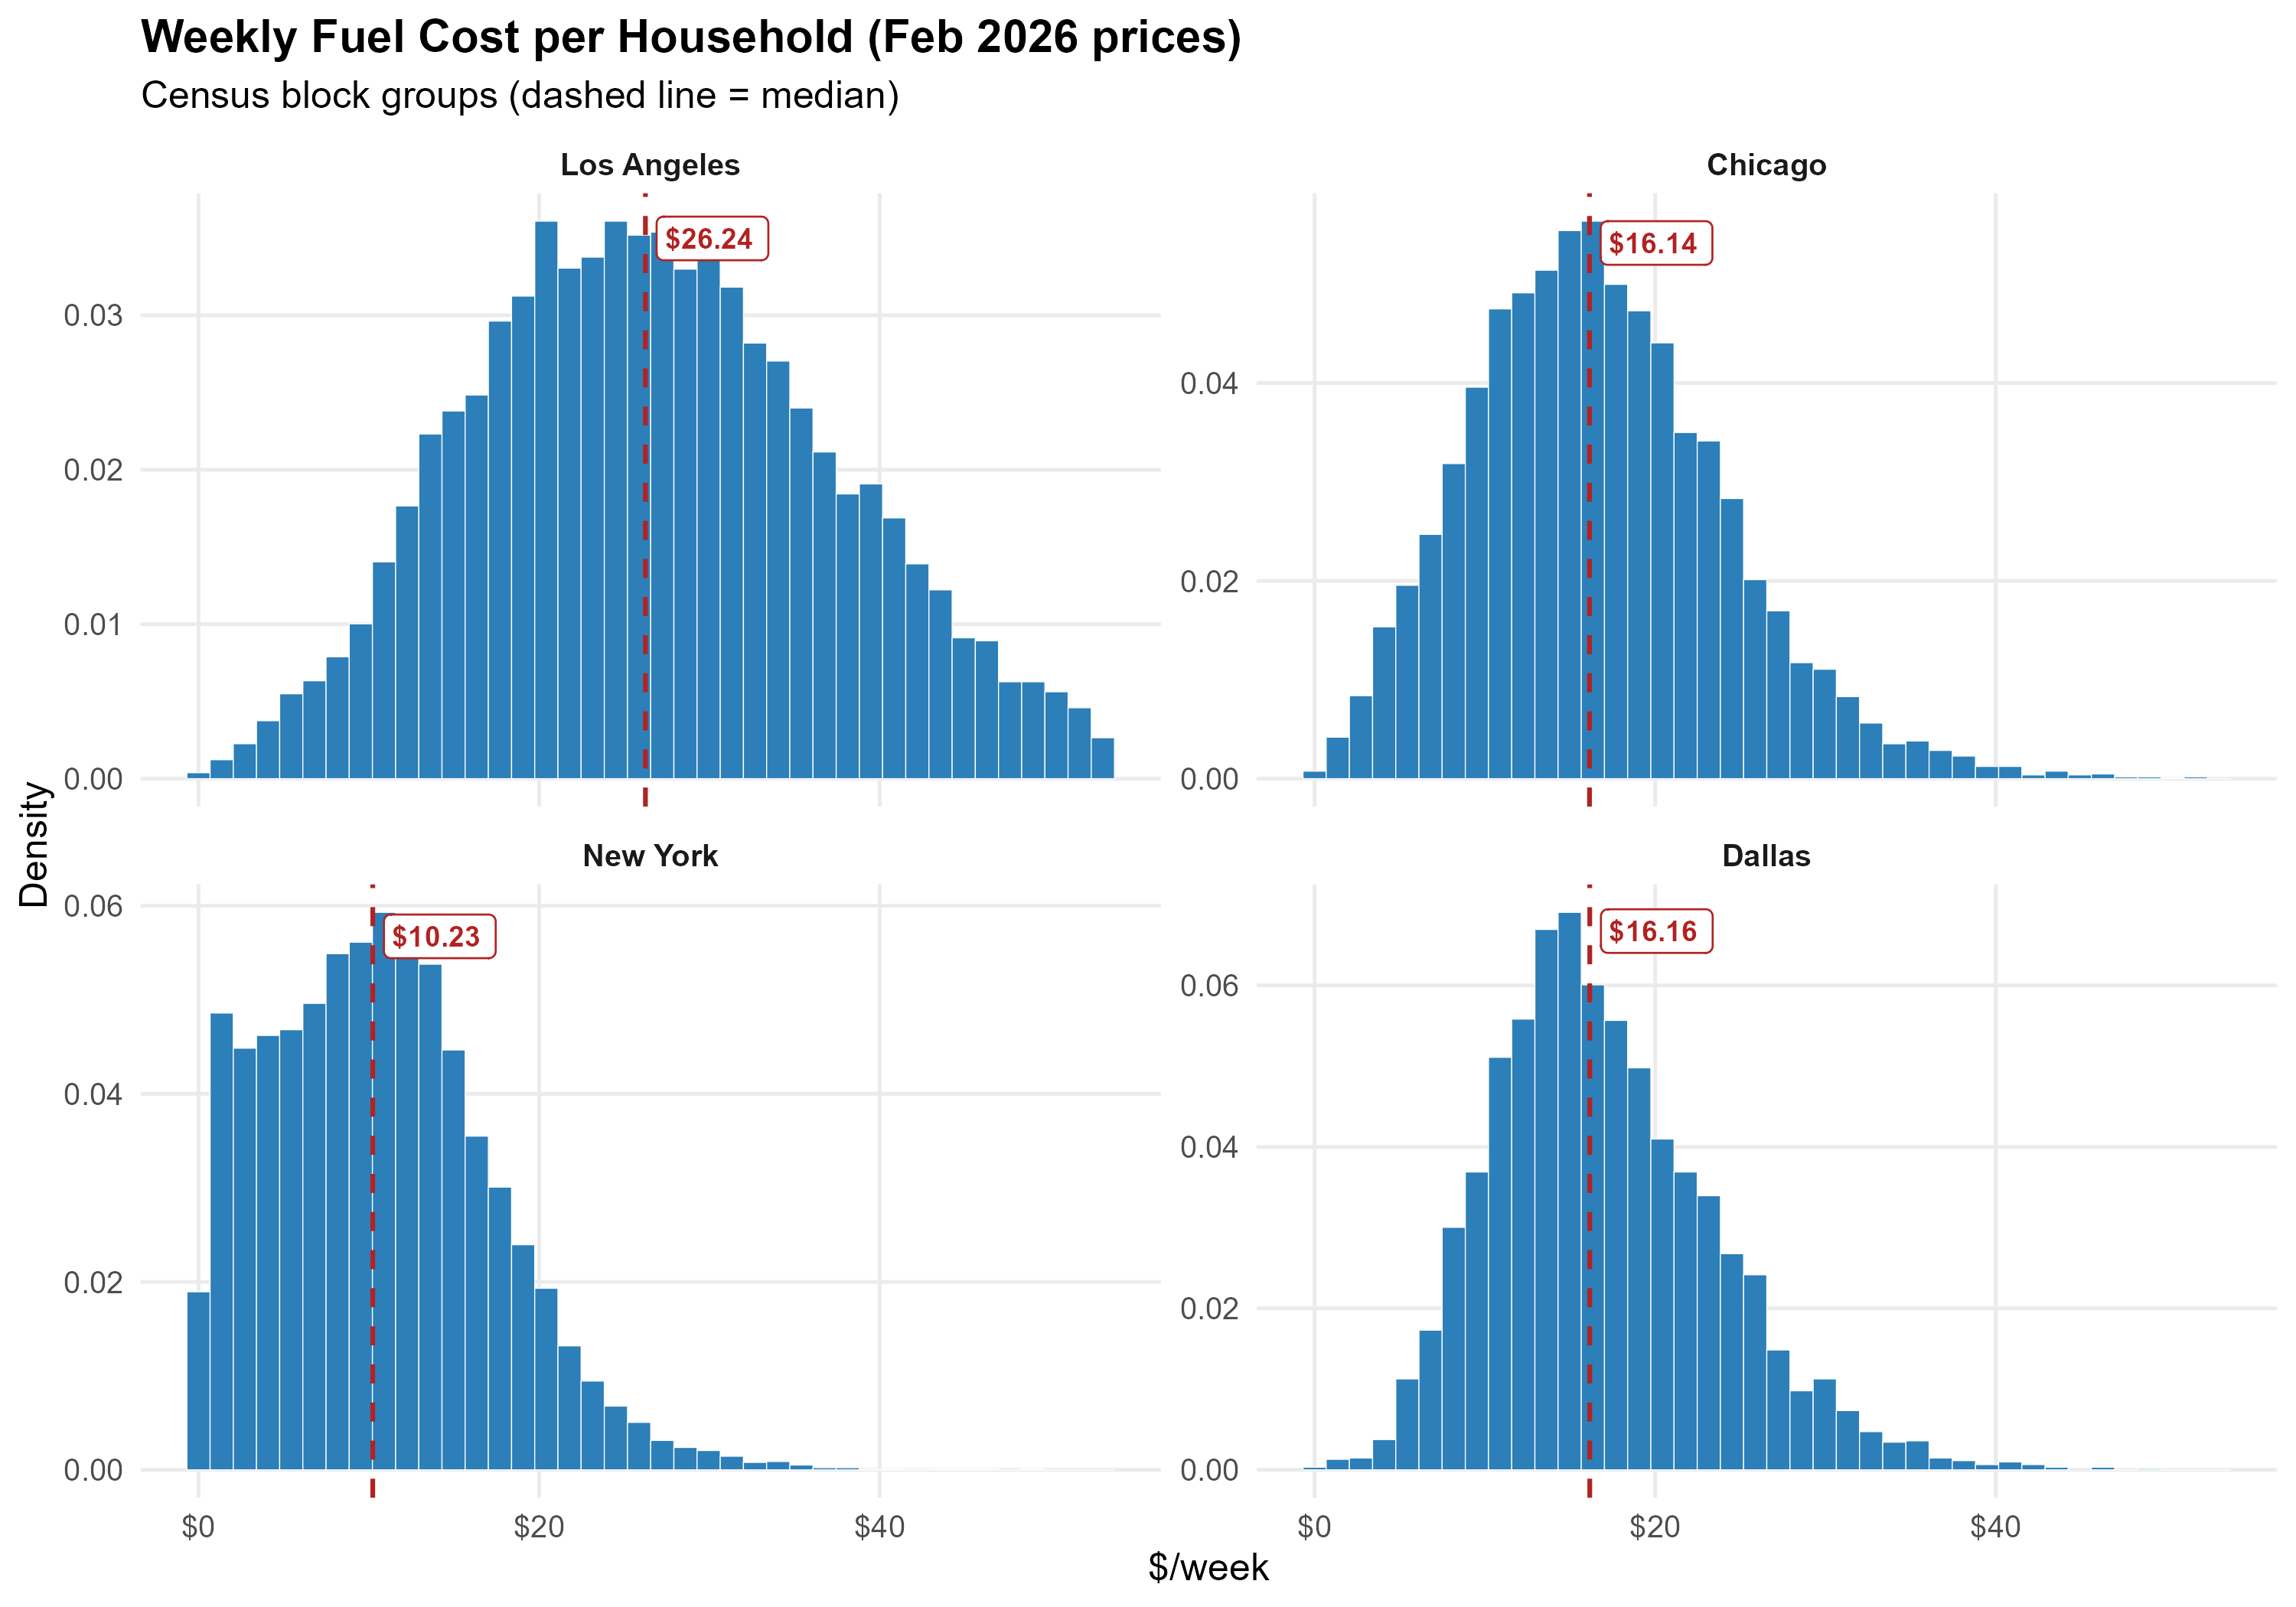
Los Angeles has the highest costs, with a median of $26.24 per week across block groups. This value is driven by long commutes and high fuel prices. Los Angeles has a price per gallon in February 2026 of $4.55, compared to Chicago’s $3.08, New York’s $2.96, and Dallas $2.52.
Chicago has a median car commuting cost of $16.14 across block groups. Dallas has long commutes, but low fuel prices reduce costs, and median commuting spending across block groups is $16.16, similar to Chicago. New York has the lowest costs, with a median of $10.21 per week, driven by the large share of households who have minimal expenses from commuting by car, as is also visible in the histogram.
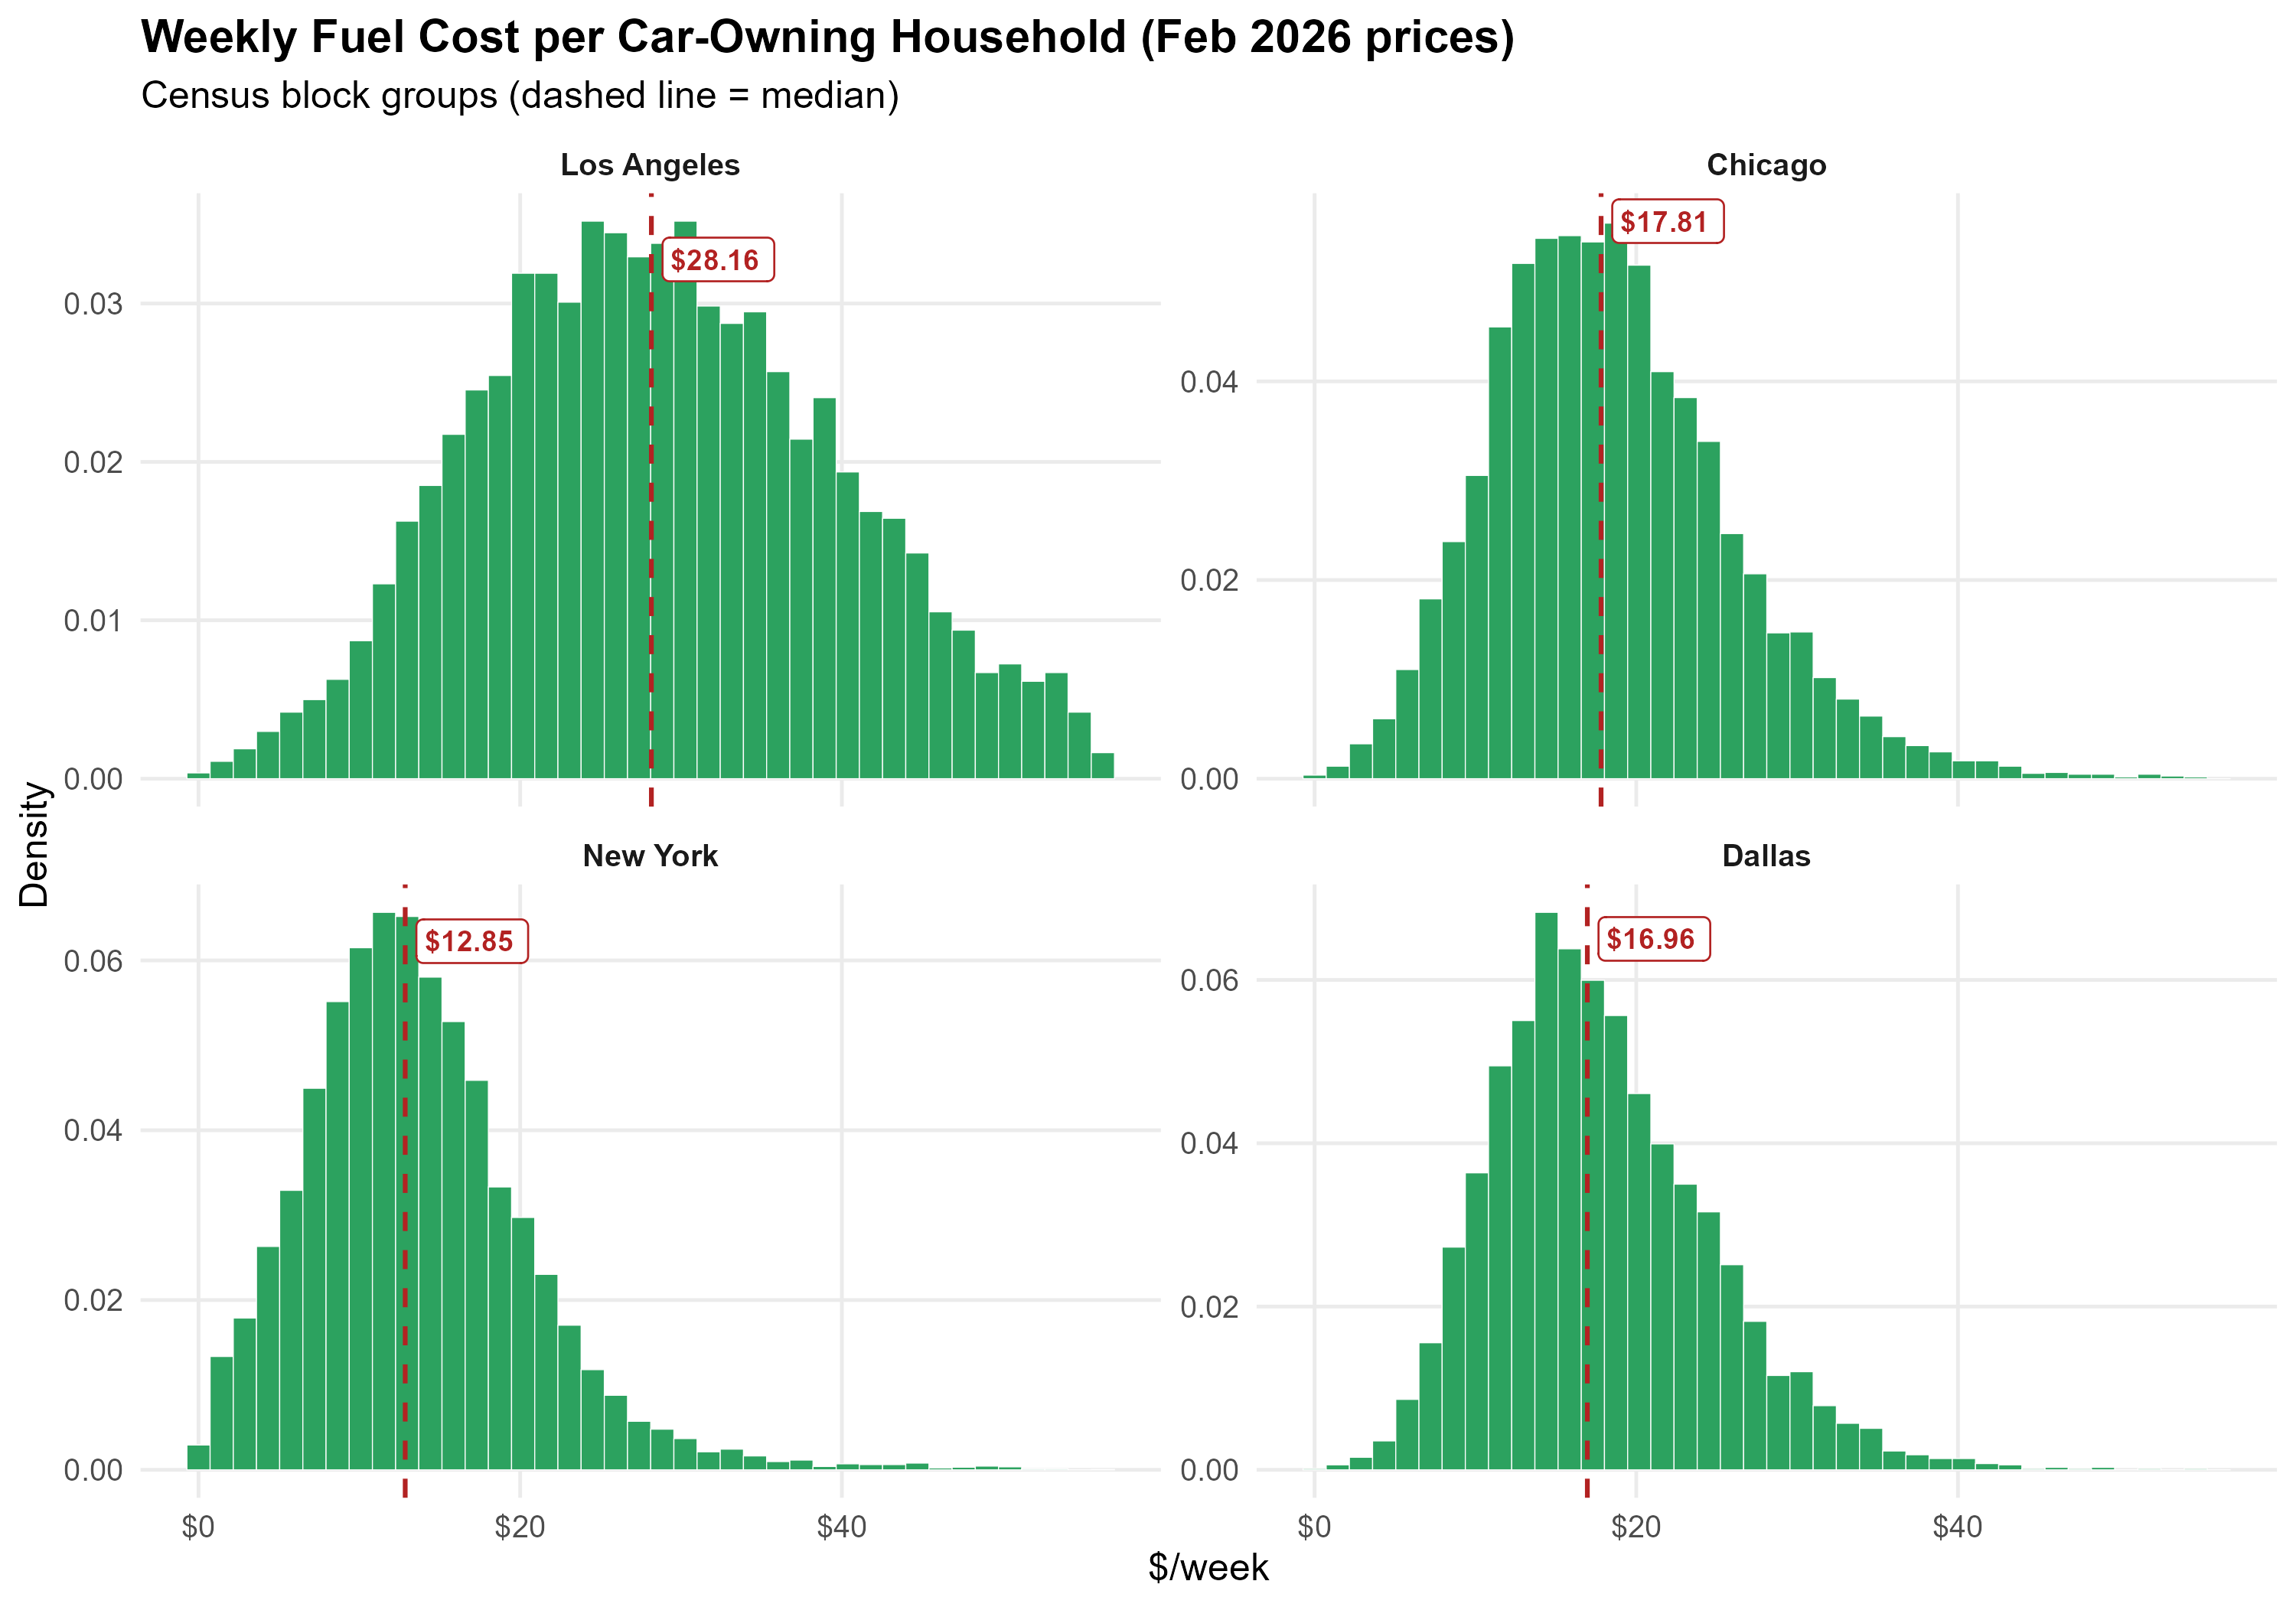
The calculations above average fuel costs across all households in a census block group, including non-car commuters. The histogram below shows the distribution when we instead calculate averages using only car-owning households within each block group. We use this alternative measure because car ownership is a reasonable proxy for car commuting.
Average costs mechanically increase across the board. Los Angeles has the highest cost of $28.16 per week, followed by Chicago at $17.81, and Dallas at $16.96. New York, despite relatively high fuel prices, remains at the bottom of the list, significantly lower than other metros, with $12.85.
Annualized, these costs are substantial, and strikingly uneven across metropolitan areas, from roughly $670 in New York to nearly $1,460 in Los Angeles.
Middle-Income Households Face the Highest Costs
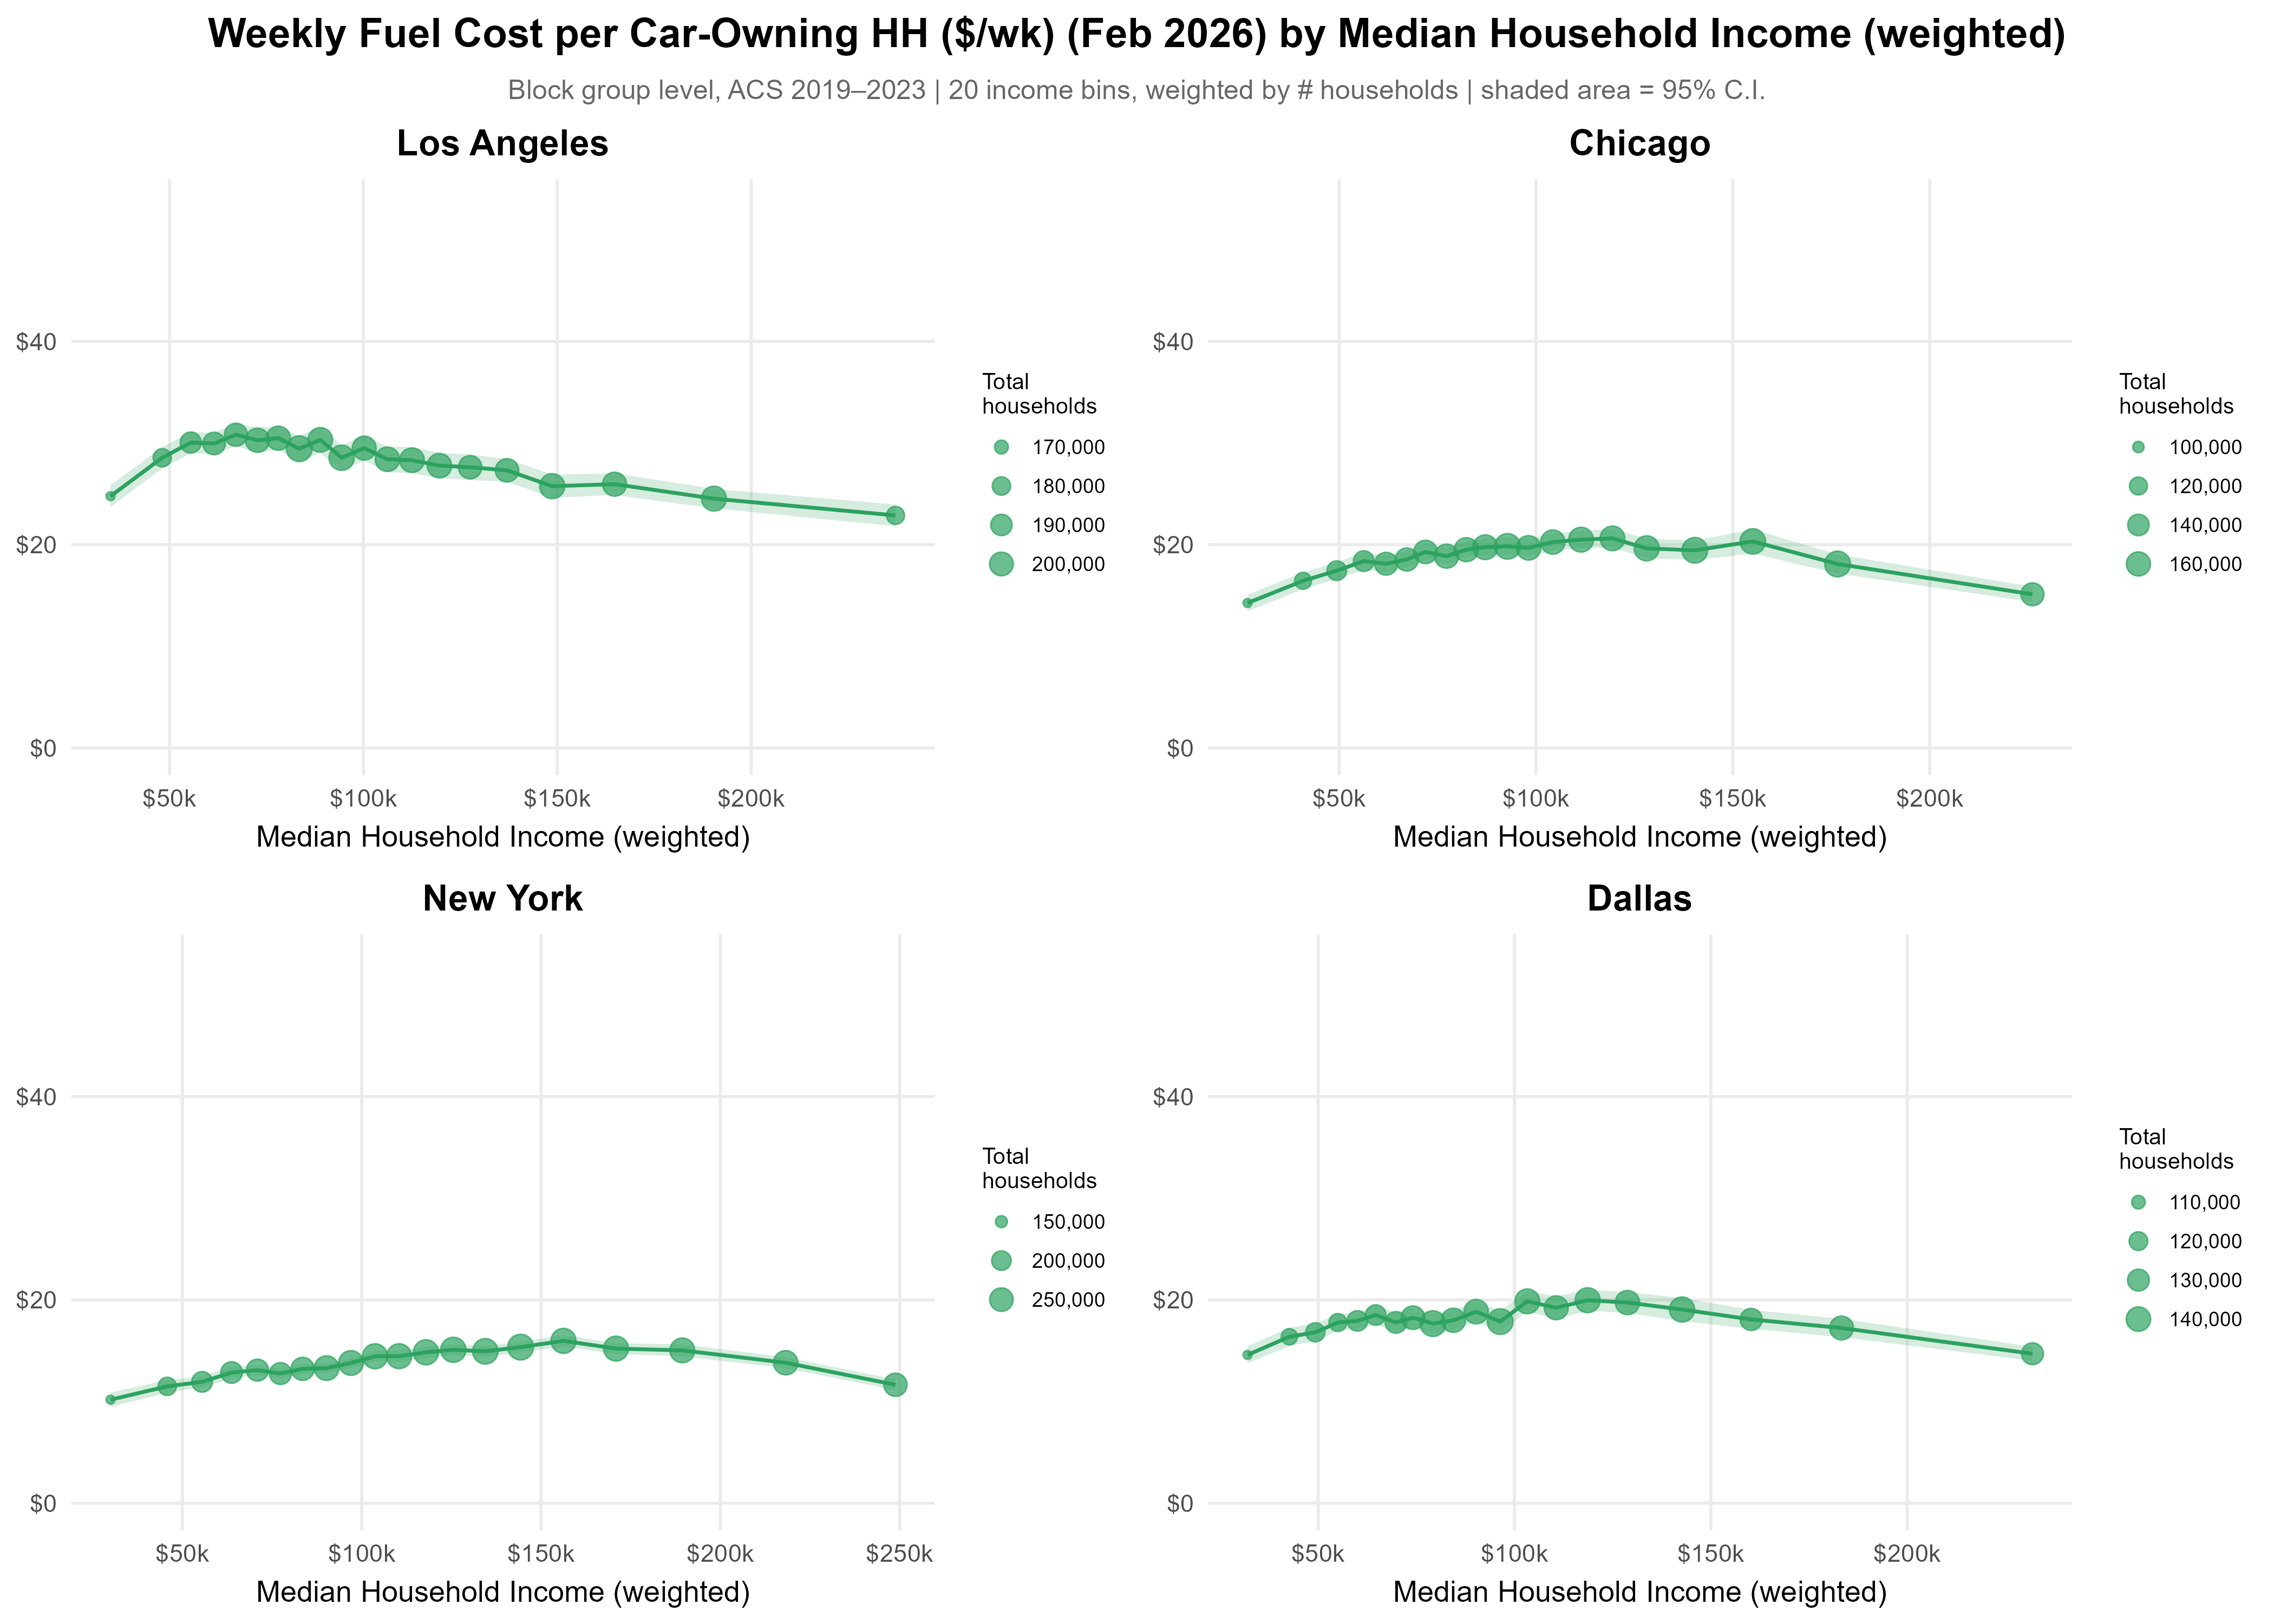
A natural question is whether these commuting fuel costs fall disproportionately on particular households. The figure below plots average weekly fuel cost per household against median household income, with block groups binned into 20 income quantiles. The shaded area shows 95% confidence intervals. Estimates are weighted by the number of households in each block group.
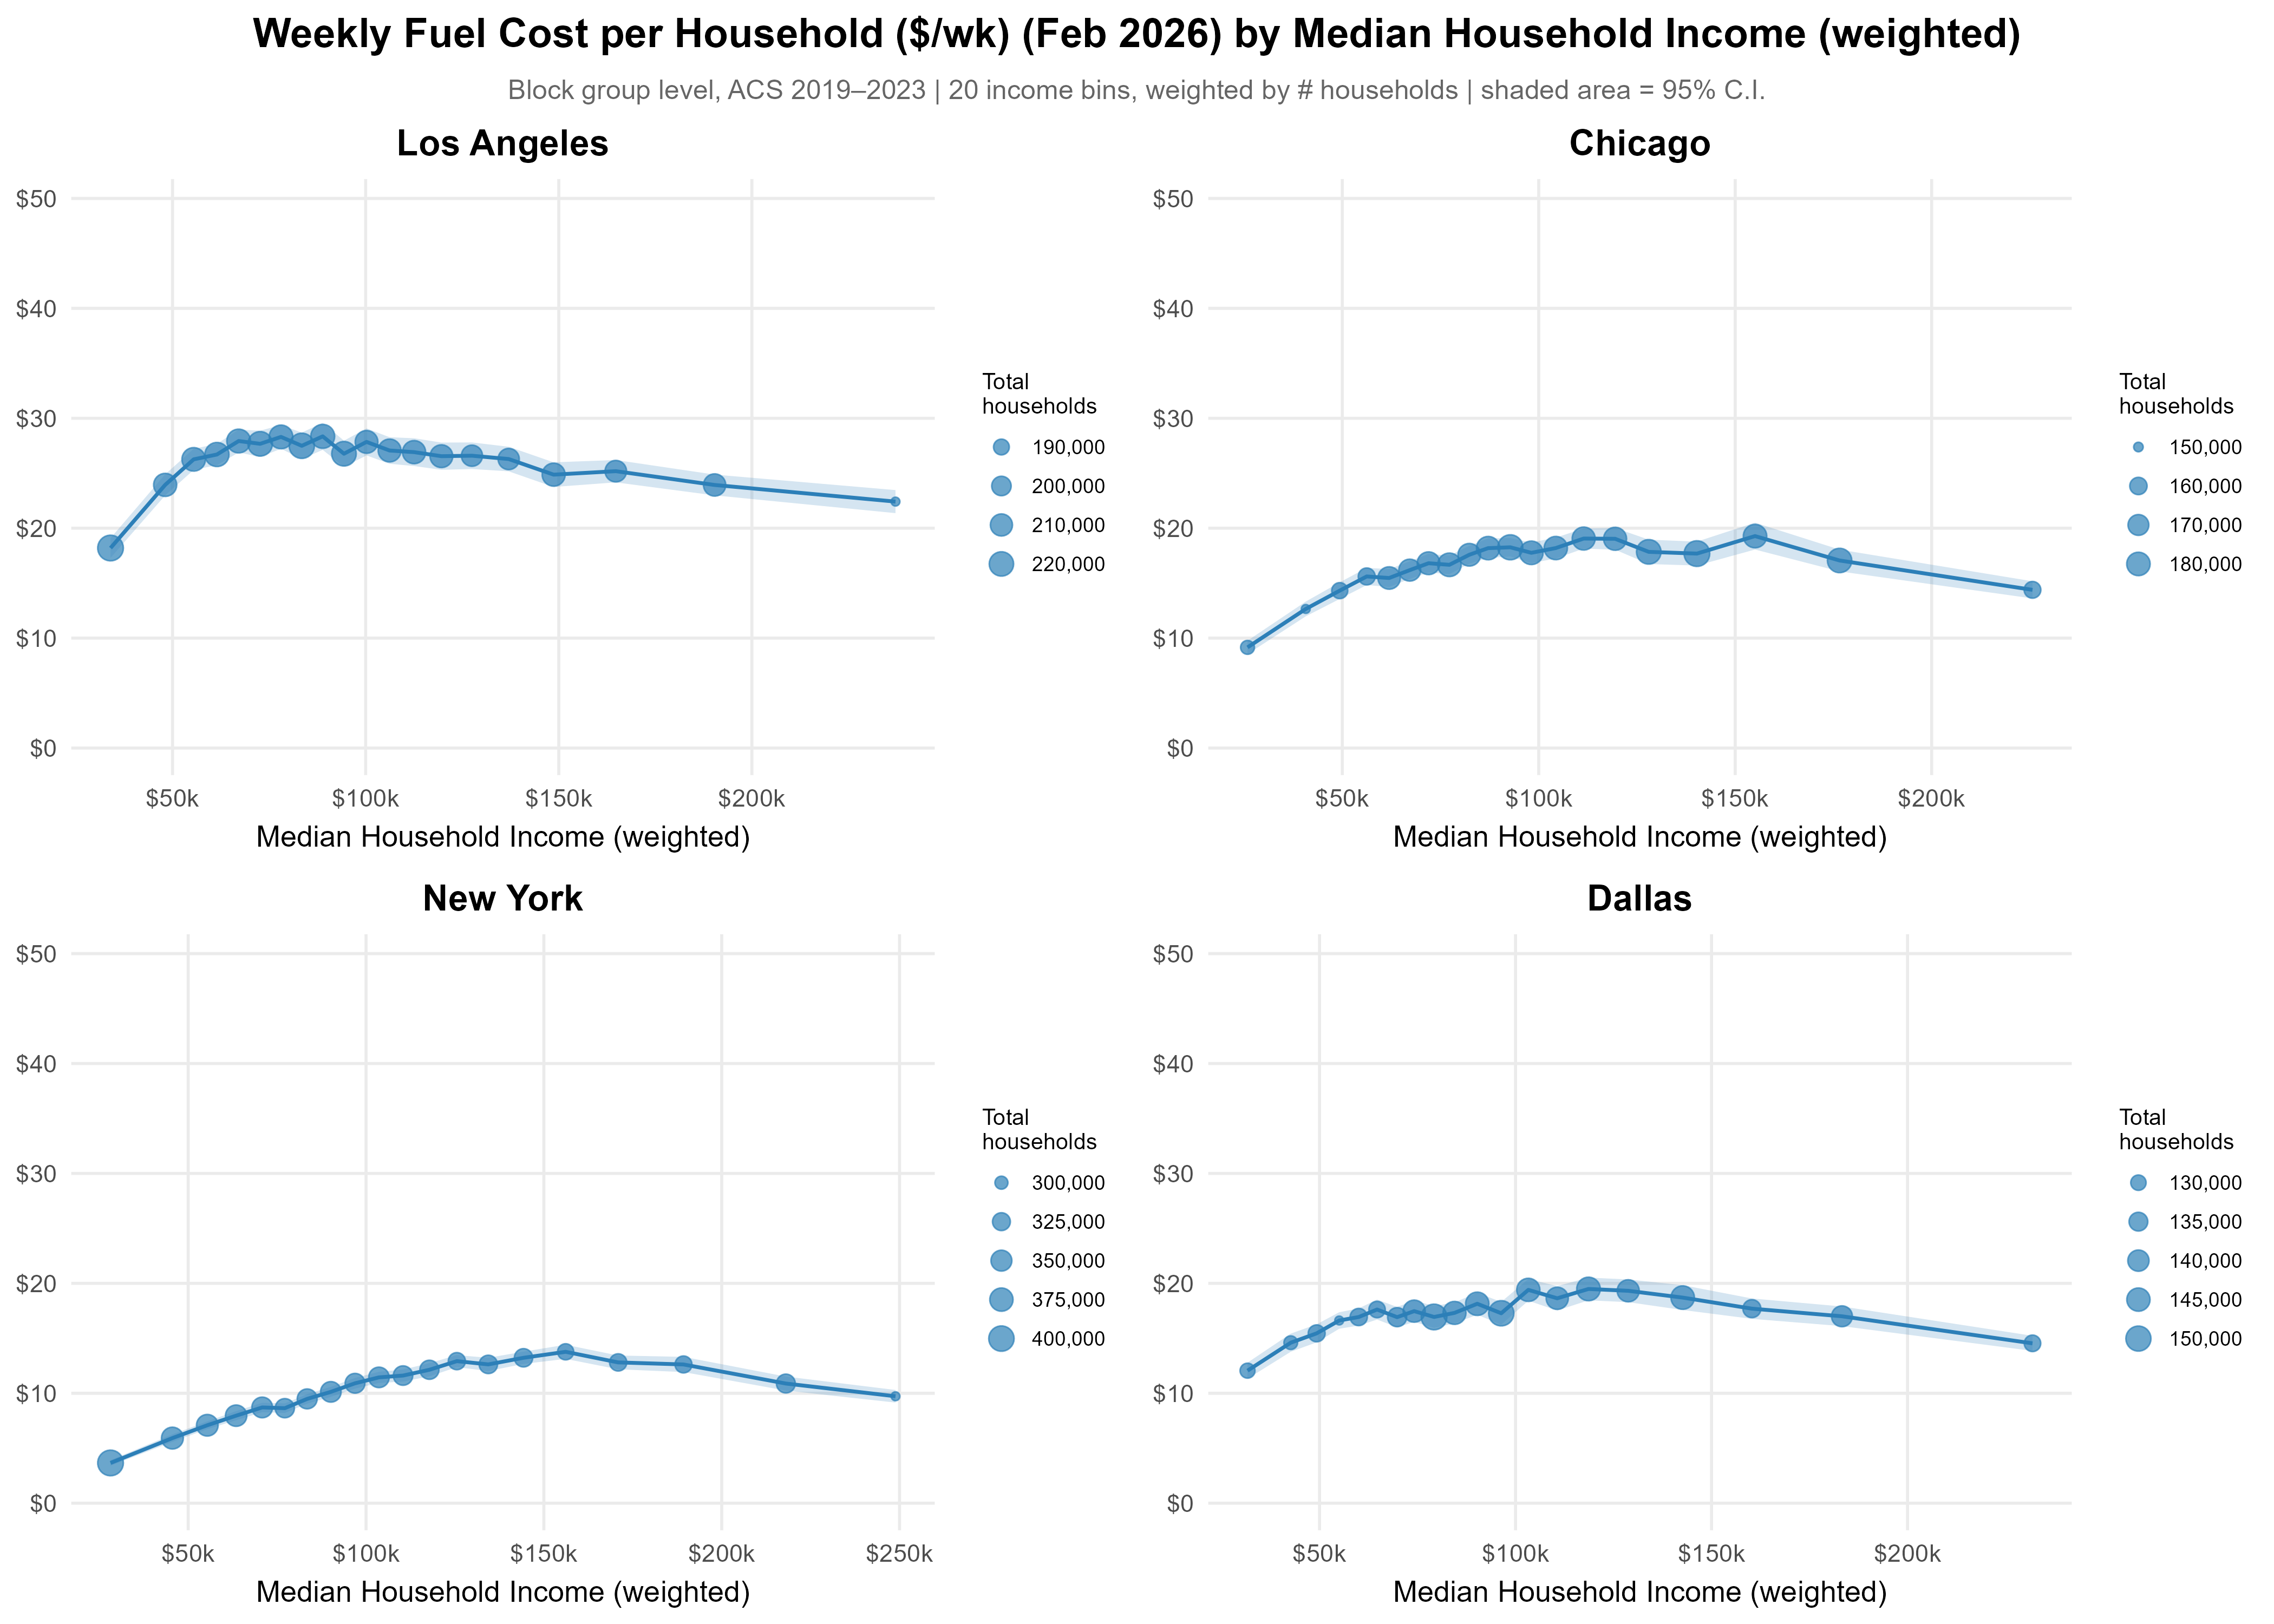
The relationship is not linear and follows an inverted U shape. In the lowest-income block groups, household fuel costs are relatively low because fewer households own cars and fewer residents commute by driving. As income rises into the middle range ($50,000–$100,000), car ownership and car commuting rates increase, pushing fuel costs up. At the highest income levels, costs plateau or decline slightly, reflecting shorter commutes in affluent neighborhoods.
This inverted-U pattern is most pronounced in New York and Los Angeles. In Dallas, the curve is flatter: nearly everyone drives regardless of income, so the relationship reflects distance more than mode choice. Chicago falls in between.
As shown in the figure below, the pattern is also present when we compute average costs using only car-owning households. Thus, this evidence is driven not only by a larger share of car owners in middle-income block groups but also by longer commuting times.
The key policy implication is that middle-income suburban households bear the highest commuting fuel burden in absolute terms. However, while low-income households spend less on commuting fuel in total dollars, the share of their budget consumed by fuel might still be higher, an important distinction that this analysis does not directly capture.
Conclusion: Putting the Results in Perspective
Our estimates suggest that commuting fuel costs are significant in all four metros, but also that there are massive differences across metros, with the typical household spending $530 a year in New York, and $1,360 a year in Los Angeles. The typical car-owning household spends $670 in New York and $1,460 in Los Angeles.
How does this compare to total household car fuel spending? Data from the National Household Travel Survey shows that commuting accounts for approximately 30 percent of total vehicle miles traveled. If we take these estimates at face value, and do a back-of-the-envelope calculation, we find that total annual car fuel costs based on February 2026 prices would, in the median block group, equal approximately $4,530 in Los Angeles, $2,800 in Chicago and Dallas, and $1,800 in New York.
Should conflict or geopolitical tensions drive fuel prices in Los Angeles back to the 2022 peak of $6.5 per gallon, the annual median car commuting cost for households across Los Angeles would rise to approximately $1,940. The inverted U-shaped cost distribution documented above further implies that the related commuting cost shock would be largest in middle-class neighborhoods.
Overall, this post highlights that car fuel costs are significant for household budgets in the U.S., and that households are highly exposed to fuel price fluctuations.