

Have housing costs outrun paychecks in the United States? Affordability sits at the center of the current policy debate. However, the answer depends on which housing cost, which measure of pay, and which time period we consider.
In this post, we compare the growth of home prices, rents, and wages since 2000. We combine national series from the S&P CoreLogic Case-Shiller index, Zillow’s home value and rent indexes, the Bureau of Labor Statistics (BLS), and Freddie Mac. We then turn to metro-level data on incomes, rents, and home values from the American Community Survey (ACS) for the 50 largest U.S. metros.
Our analysis reveals some interesting facts. First, since 2000, home prices have risen 227% and rents 146%, while the median full-time worker’s weekly earnings rose 121%. Consumer prices rose 96% over the same period.
Second, since 2000, the rent paid by the typical tenant has absorbed a remarkably stable 21% to 24% of a median full-time worker’s gross pay. Rents on new leases jumped in 2021 and 2022, but wages have since caught up.
Third, the mortgage payment on a typical home took 23% of a median full-time worker’s pay in 2019 and takes 35% today, after peaking at 41% in late 2023, above the 2006 bubble peak. Most of the increase reflects higher mortgage rates.
Fourth, between 2015 and 2024, home values grew faster than incomes in all 49 metros we can compare, especially in the Sun Belt. Los Angeles remains the least affordable city, with a median home value 9.4 times median household income.
Data and Approach
We measure national home prices with the Case-Shiller U.S. National Home Price Index and rents with the BLS Consumer Price Index (CPI) for rent of primary residence. Because the CPI covers all tenants, including those whose rents adjust slowly, it lags market rents. We therefore add the BLS New Tenant Rent Index, which tracks rents for households moving into a new unit and runs from 2005 to early 2025. Because it comes from the same BLS housing survey as the CPI, the two rent series are directly comparable. To express it in dollars, we set its level equal to Zillow’s typical asking rent in 2015-2016. We also report Zillow’s Observed Rent Index (ZORI), which covers asking rents from 2015 onward. For home values, we use Zillow’s Home Value Index (ZHVI), which tracks the value of a typical mid-priced home. Wages are the BLS median weekly earnings of full-time wage and salary workers. Mortgage rates are Freddie Mac’s 30-year fixed rate.
To translate prices into a monthly cost, we compute the principal-and-interest payment on a 30-year fixed-rate mortgage for the typical home, assuming a 20% down payment. For rents, we need a dollar series that goes back to 2000. We convert the CPI rent index into dollars by fixing it to the ACS median contract rent, which, like the CPI, excludes utilities. We then divide each monthly cost by the gross monthly pay of a median full-time worker.
For metros, we use ACS 1-year estimates for 2015, 2019, and 2024, the most recent year available at the time of writing. For the 50 largest metros, we observe median household income, median renter household income, median gross rent (rent plus utilities), and the median owner-reported home value.
Twenty-Five Years of Prices, Rents, and Pay
The figure below plots each national series as an index equal to 100 in the first quarter of 2000.
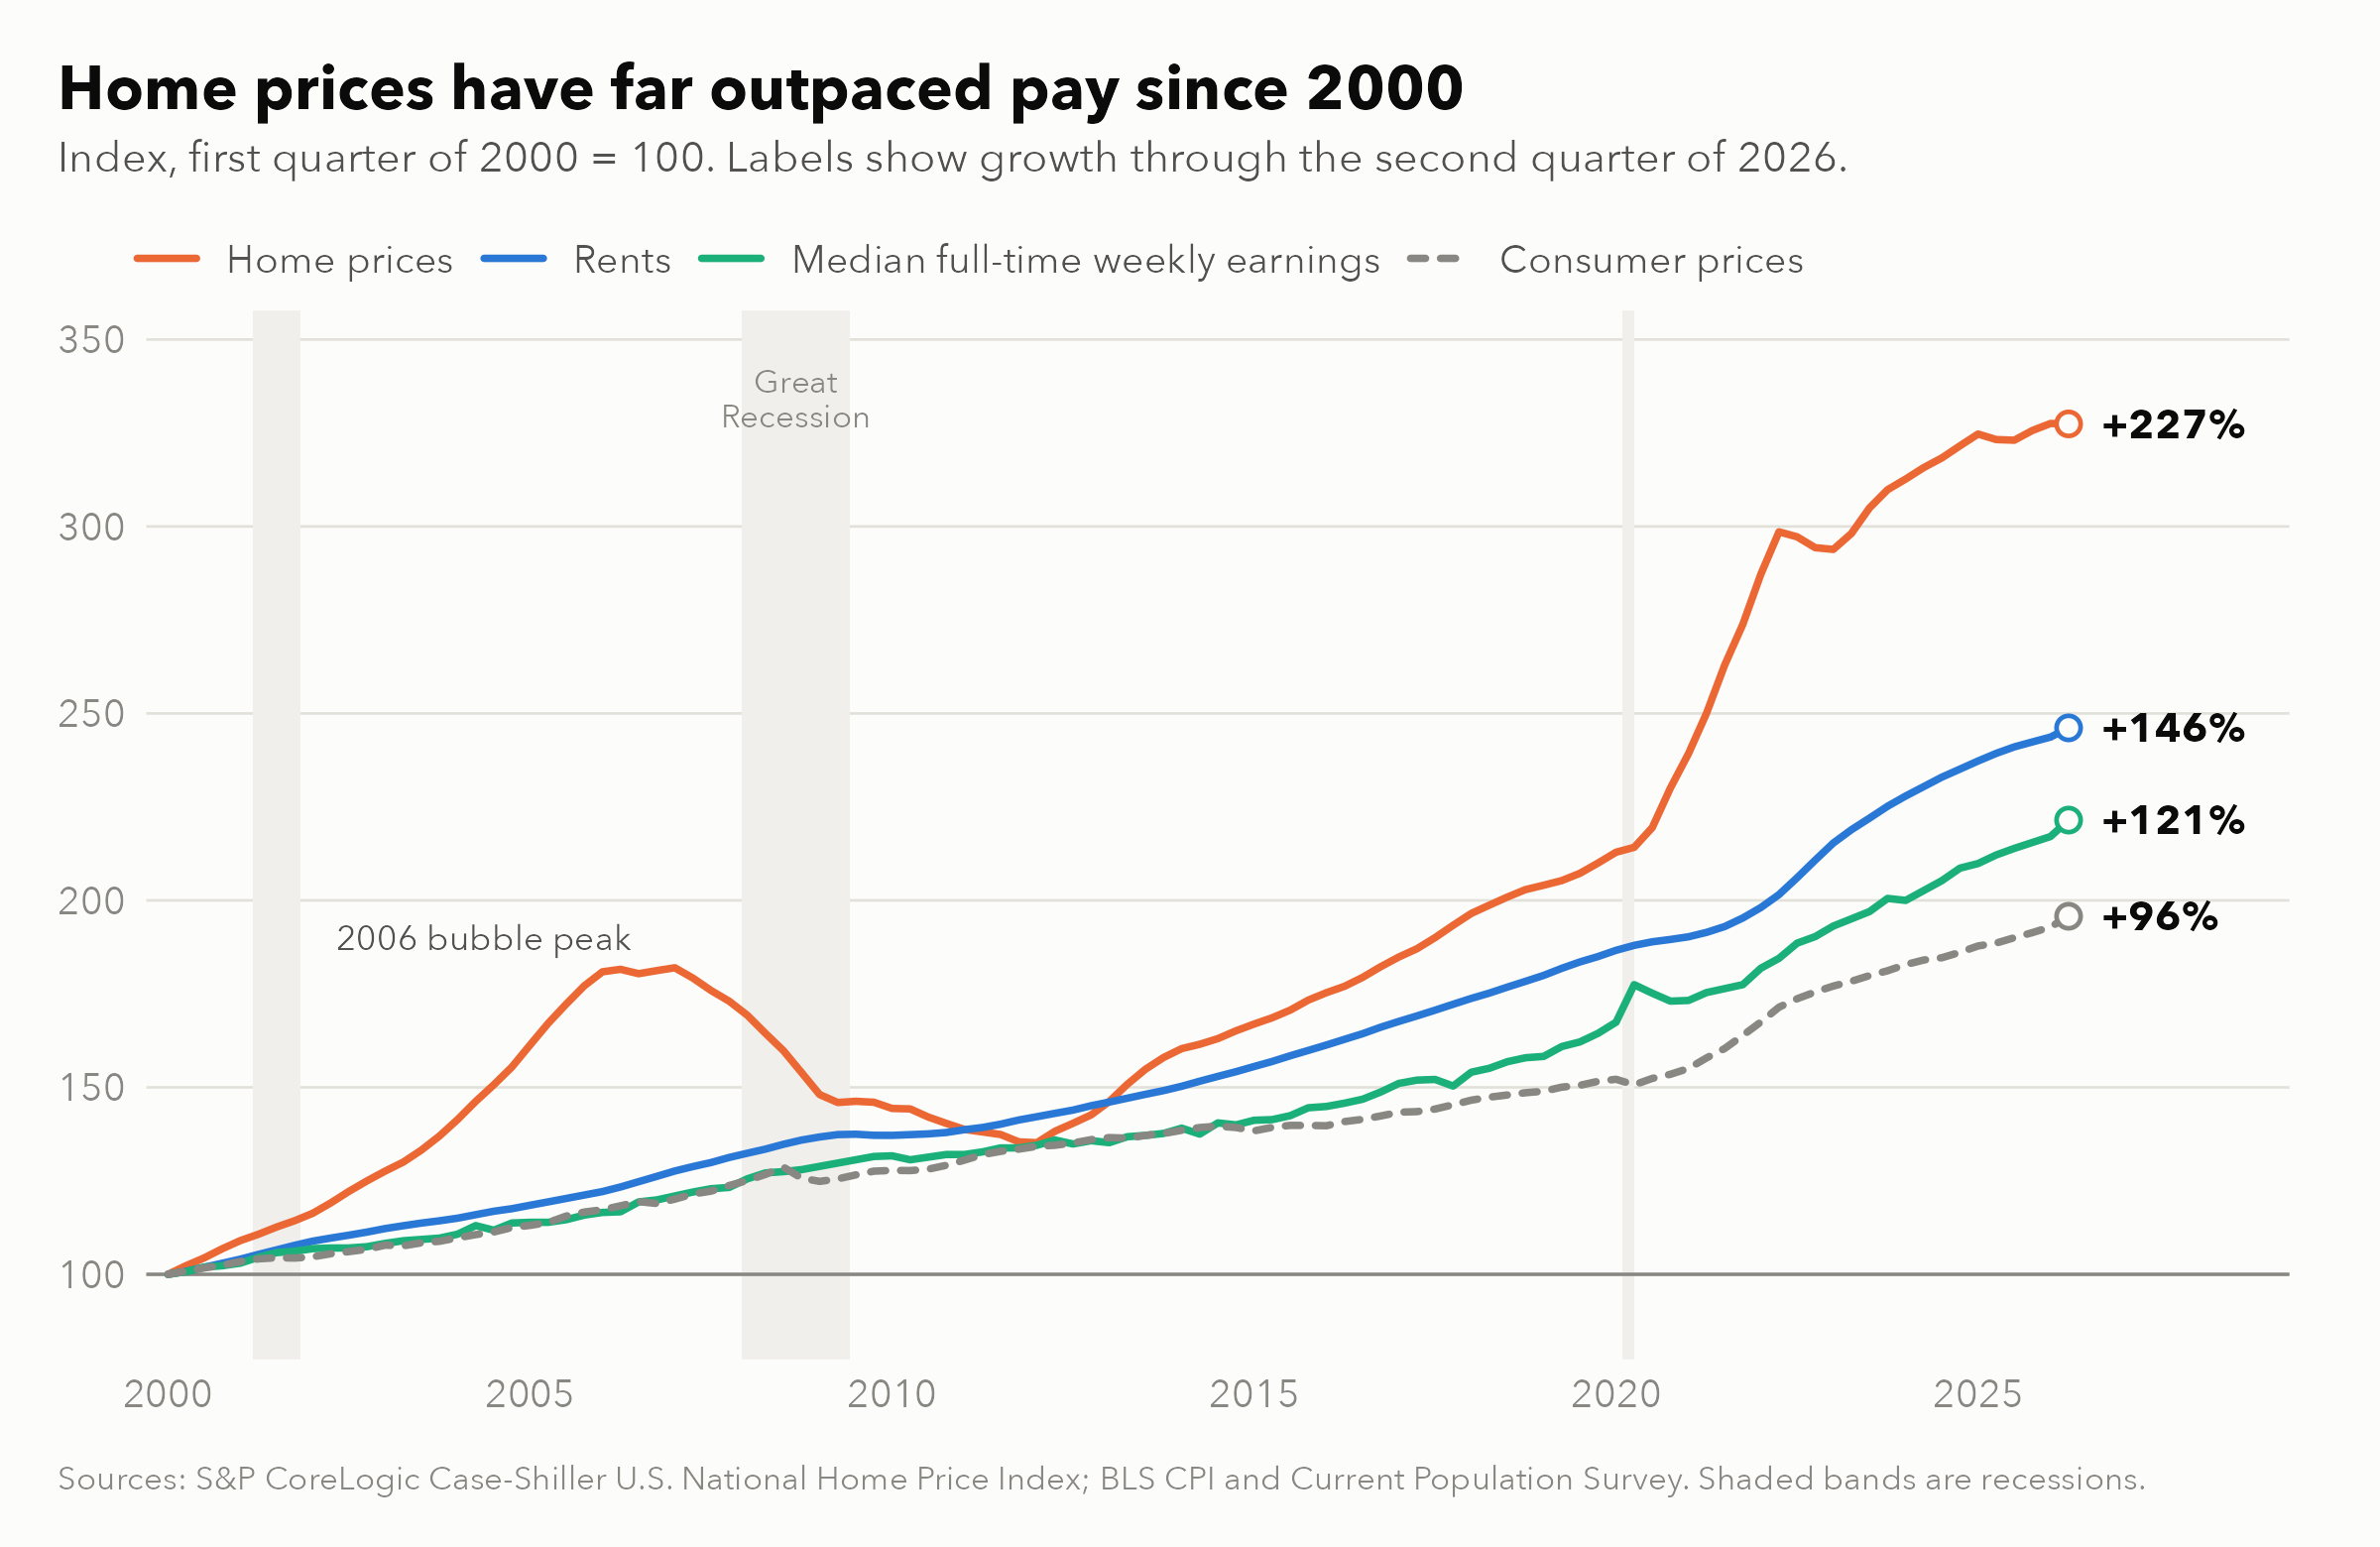
Three patterns stand out. First, relative to wages, home prices rose 56% between 2000 and the 2006 peak, fell back to their 2000 level by 2012, and then climbed again to a new high in mid-2022, 62% above the 2000 ratio. Today, home prices relative to wages sit 48% above their 2000 level.
Second, rents have grown faster than wages, but by much less. The ratio of rents to wages is 11% higher today than in 2000, and most of that gap opened before 2019.
Third, pay has grown faster than consumer prices: 121% since 2000 versus 96%, and 35% since the end of 2019 versus 29%. In other words, real wages rose, but nowhere near enough to keep pace with home prices, which grew 56% since the end of 2019.
Renting: A Pandemic Shock That Wages Have Largely Absorbed
The figure below shows the share of a median full-time worker’s gross monthly pay absorbed by three housing costs: the rent paid by all tenants (blue), rent on new leases (green, from 2005), and the mortgage payment on a typical home (orange). The open circles show the ACS median contract rent, which we use to anchor the CPI series.
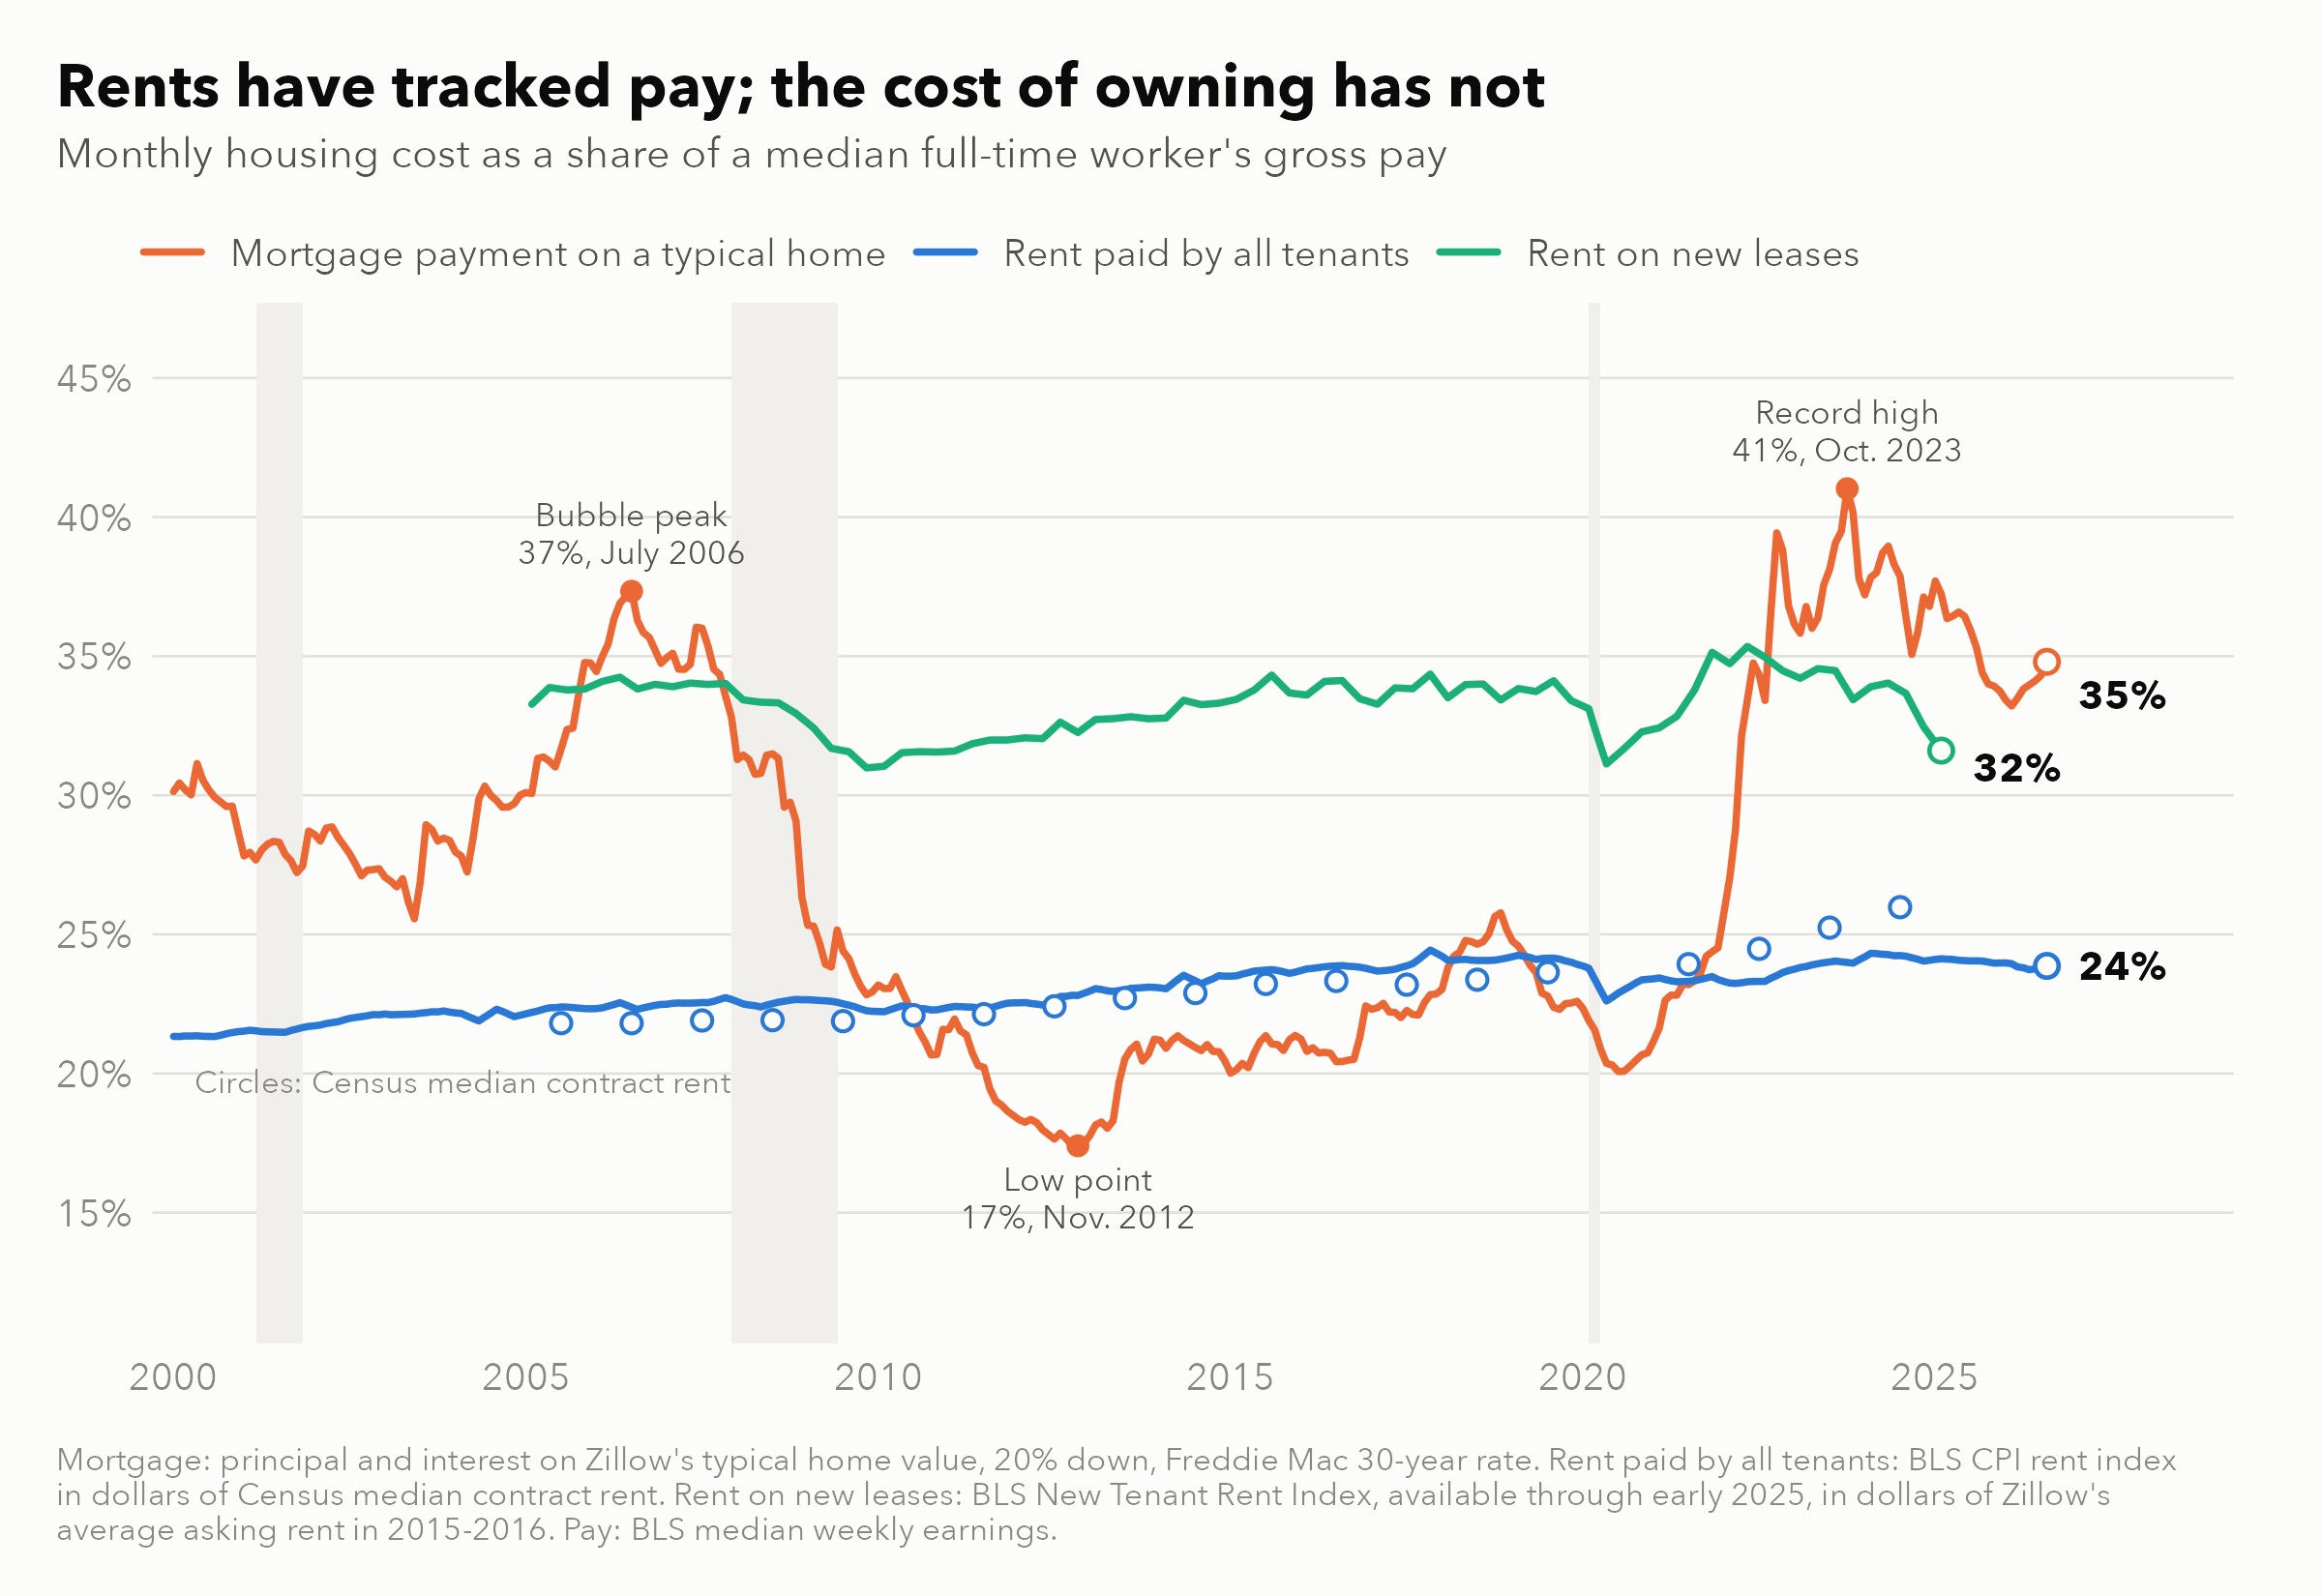
The rent line is strikingly flat. The rent paid by all tenants absorbed 21% of median pay in 2000 and has stayed between 21% and 24% ever since. It stands at 24% today. Over a quarter century that included a housing bubble, a financial crisis, and a pandemic, rents and pay moved almost synchronously.
Rents on new leases are higher and more volatile because newly leased units skew toward newer, better-located housing and reprice immediately. Still, they also tracked pay closely, absorbing between 31% and 34% of median pay from 2005 to 2019. The share rose during the post-pandemic rent surge, peaking at 35% in May 2022. It then fell to 32% by early 2025, below its 2019 level of 34%.
Zillow’s asking rents tell a somewhat less favorable story. They peaked at 38% of median pay in June 2022 and stand at 36% today, slightly above the 35% of 2019. Both measures agree on the main point, however: since 2023, rents on new leases have grown more slowly than pay.
The ACS medians, shown by the circles, suggest some recent deterioration. Median contract rent rose from 24% of median pay in 2019 to 26% in 2024. Before 2020, the CPI-based series tracks the ACS within 3%. After 2020, the two diverge, and by 2024 the ACS median is 7% higher. A likely reason is that the CPI follows the same units over time, while the ACS median also reflects new, higher-quality units entering the rental stock and changes in who rents, as we discuss below.
Owning: Costs Above the Bubble Peak
The red line tells a very different story. In 2019, the monthly payment on a typical home averaged $924, or 23% of the median full-time worker’s gross pay of $3,975. By August 2026, the payment reached $1,897, while monthly pay rose to $5,451. The payment now absorbs 35% of pay. The share peaked at 41% in October 2023, above the 37% reached at the height of the housing bubble in July 2006.
To give a sense of magnitude, the 11.5-percentage-point increase since 2019 amounts to roughly $630 per month, or about $7,500 per year, for a median full-time worker. Measured against median household income, which often includes more than one earner, the share rose from 16% in 2019 to 26% in August 2026, close to its 2006 average.
The comparison with renting is telling. For most of 2010 to 2021, the mortgage payment on a typical home was lower than the rent paid by the typical tenant, and far below the rent on a new lease. For a renter weighing a purchase, buying was the cheaper option by a wide margin. Since September 2022, the reverse has been true: in early 2025, the mortgage payment on a typical home absorbed 37% of median pay, against 32% for a new lease.
A natural question is whether this deterioration reflects prices or interest rates. If mortgage rates were still at their 2019 average of 3.9%, today’s typical home would absorb 26% of median pay, rather than 35%. Conversely, if home prices had grown exactly in line with wages since 2019, today’s 6.7% rate would still push the share to 32%. The two exercises suggest that roughly three-quarters of the increase since 2019 reflects higher mortgage rates rather than prices outrunning wages. This matters because rates can fall faster than prices adjust, so lower rates could close much of today’s gap. Higher rates have also kept existing owners in place. In a previous R.E.A.L. post, we documented a sharp drop in owner-to-owner moves in 2021 to 2023, consistent with mortgage rate lock-in, and a decline in renter-to-owner transitions from 7.3% to 5.5% per year.
Across Metros: Home Values Outran Incomes Everywhere
National averages hide large local differences. The figure below compares the growth of median home values and median household incomes between 2015 and 2024 in the 50 largest metros. The dashed line marks equal growth.
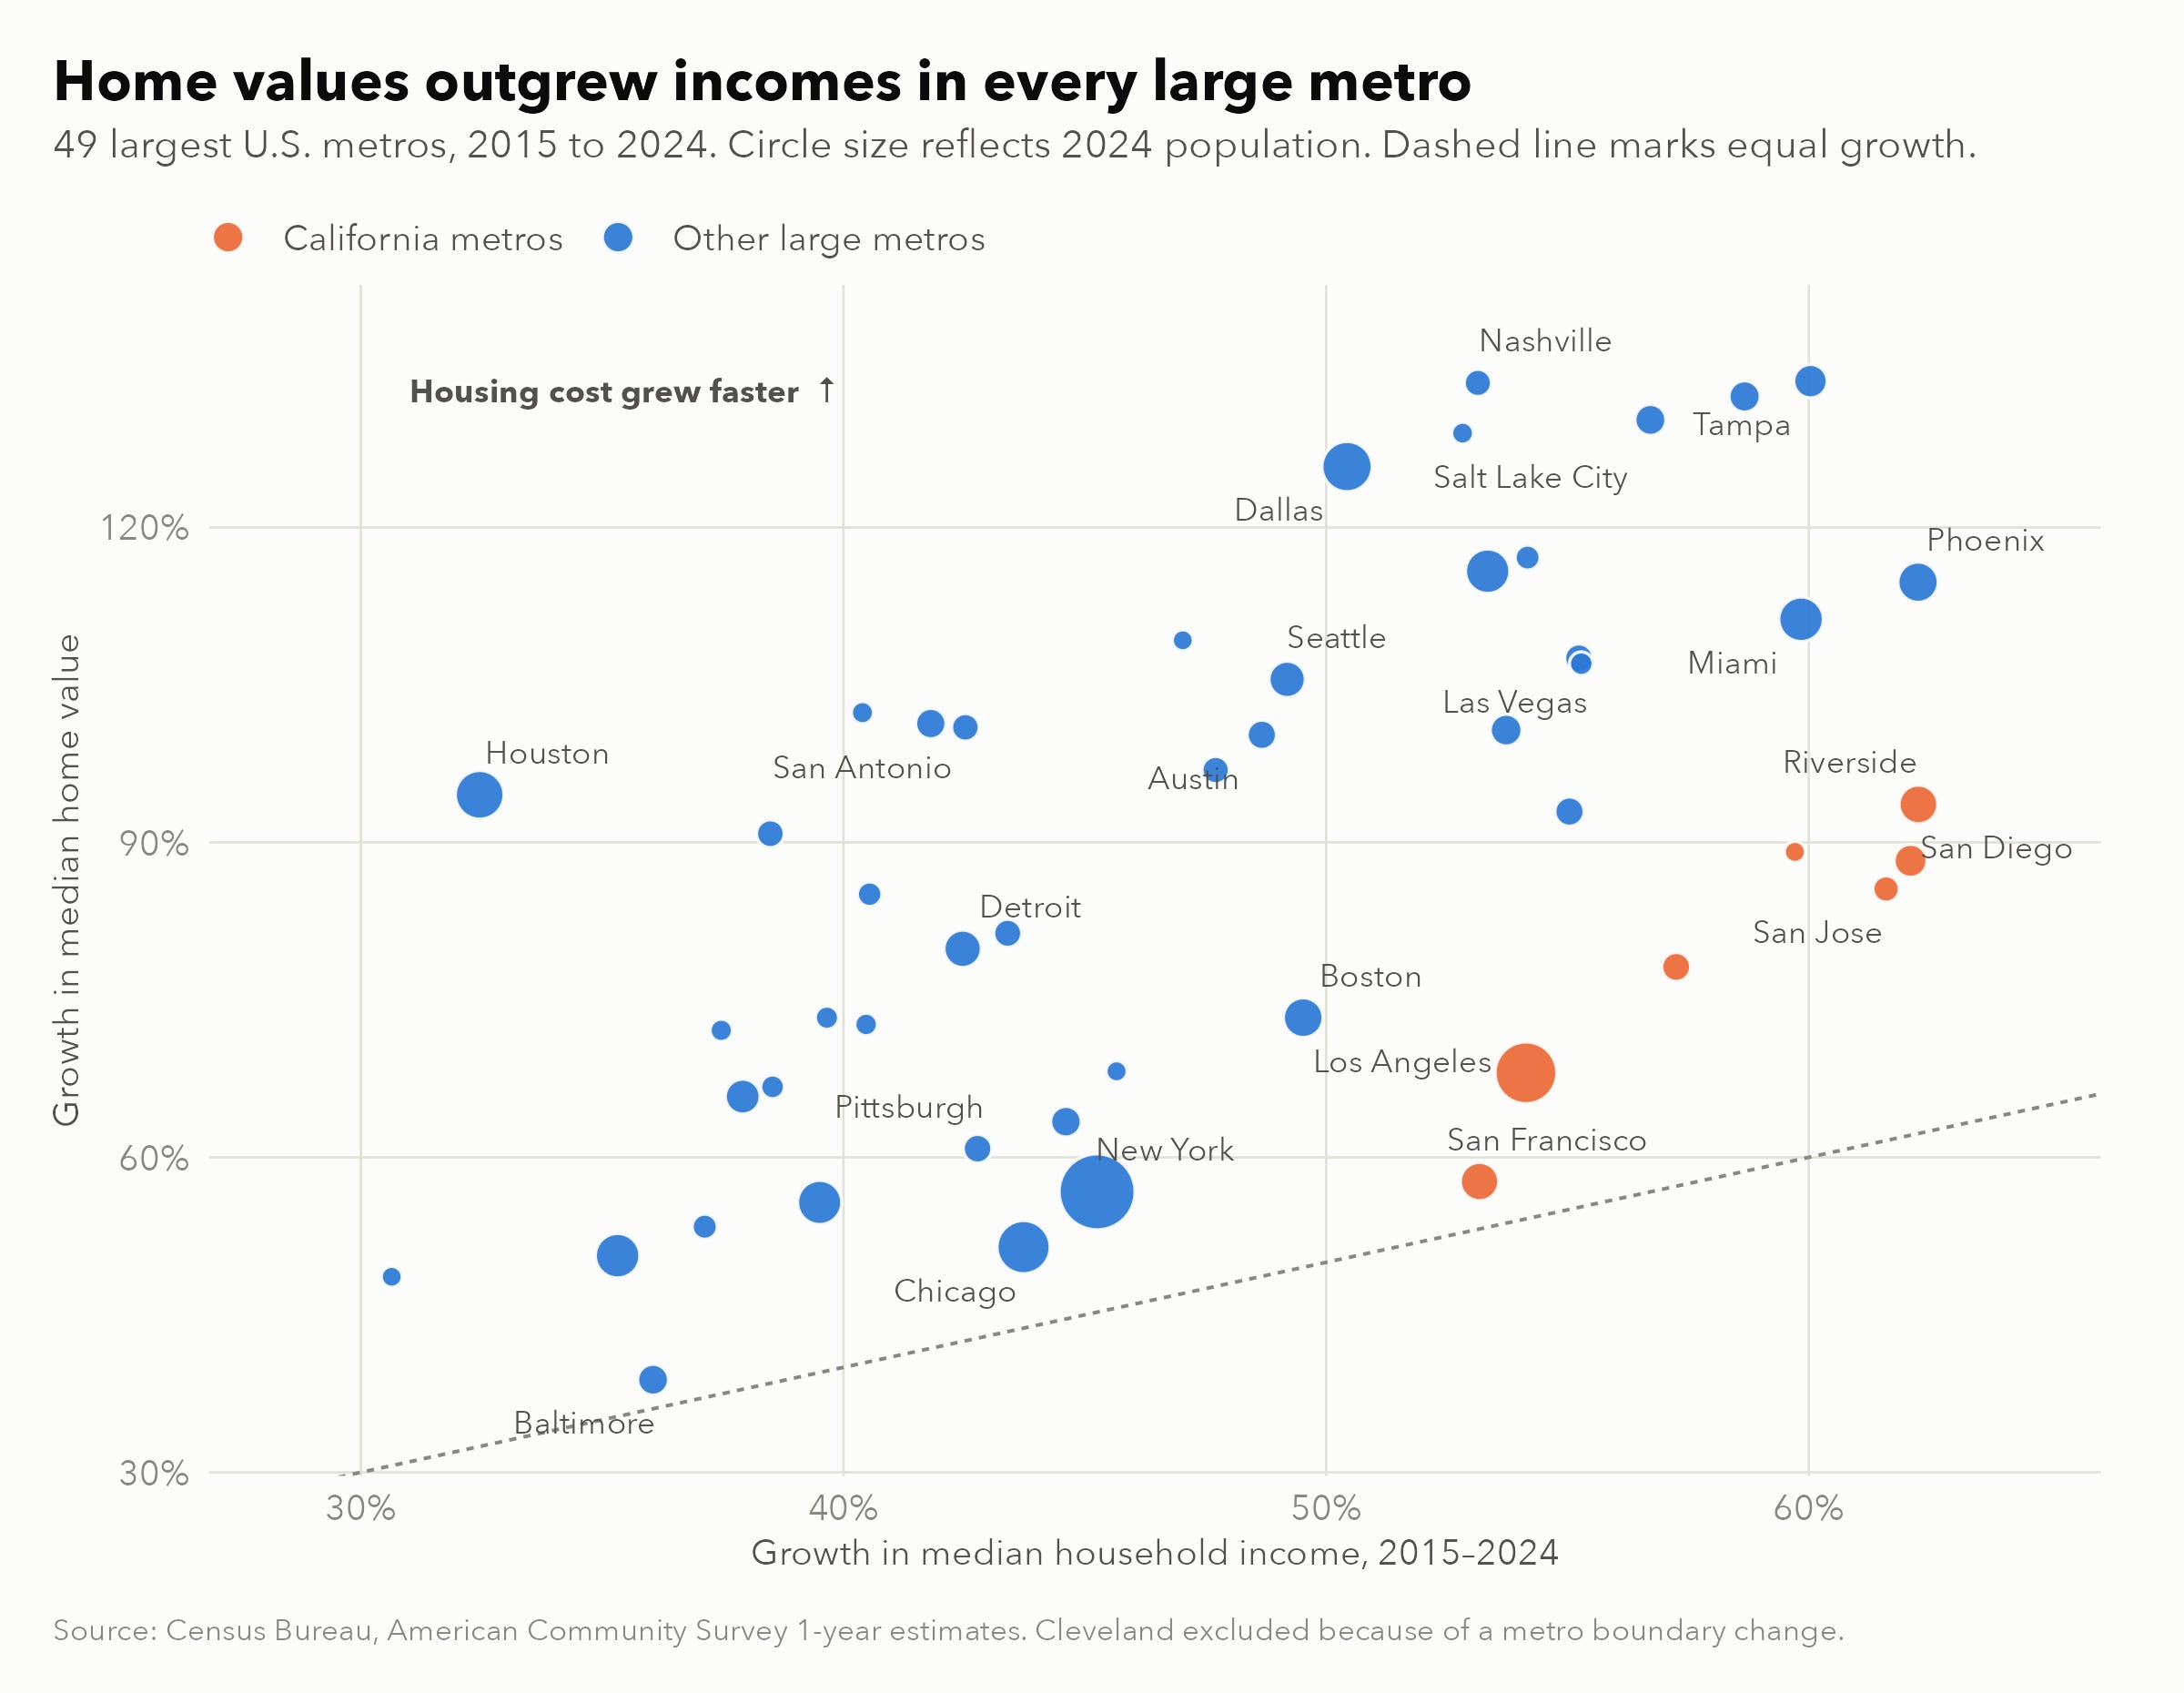
Every metro sits above the line. In the median metro, home values rose 89% while incomes rose 48%. The gaps are largest in the Sun Belt and the Mountain West: in Nashville, home values rose 134% and incomes 53%, with Tampa, Salt Lake City, and Dallas close behind. The smallest gaps are in Baltimore, San Francisco, Chicago, and New York.
The figure below shows the resulting change in the ratio of median home value to median household income.
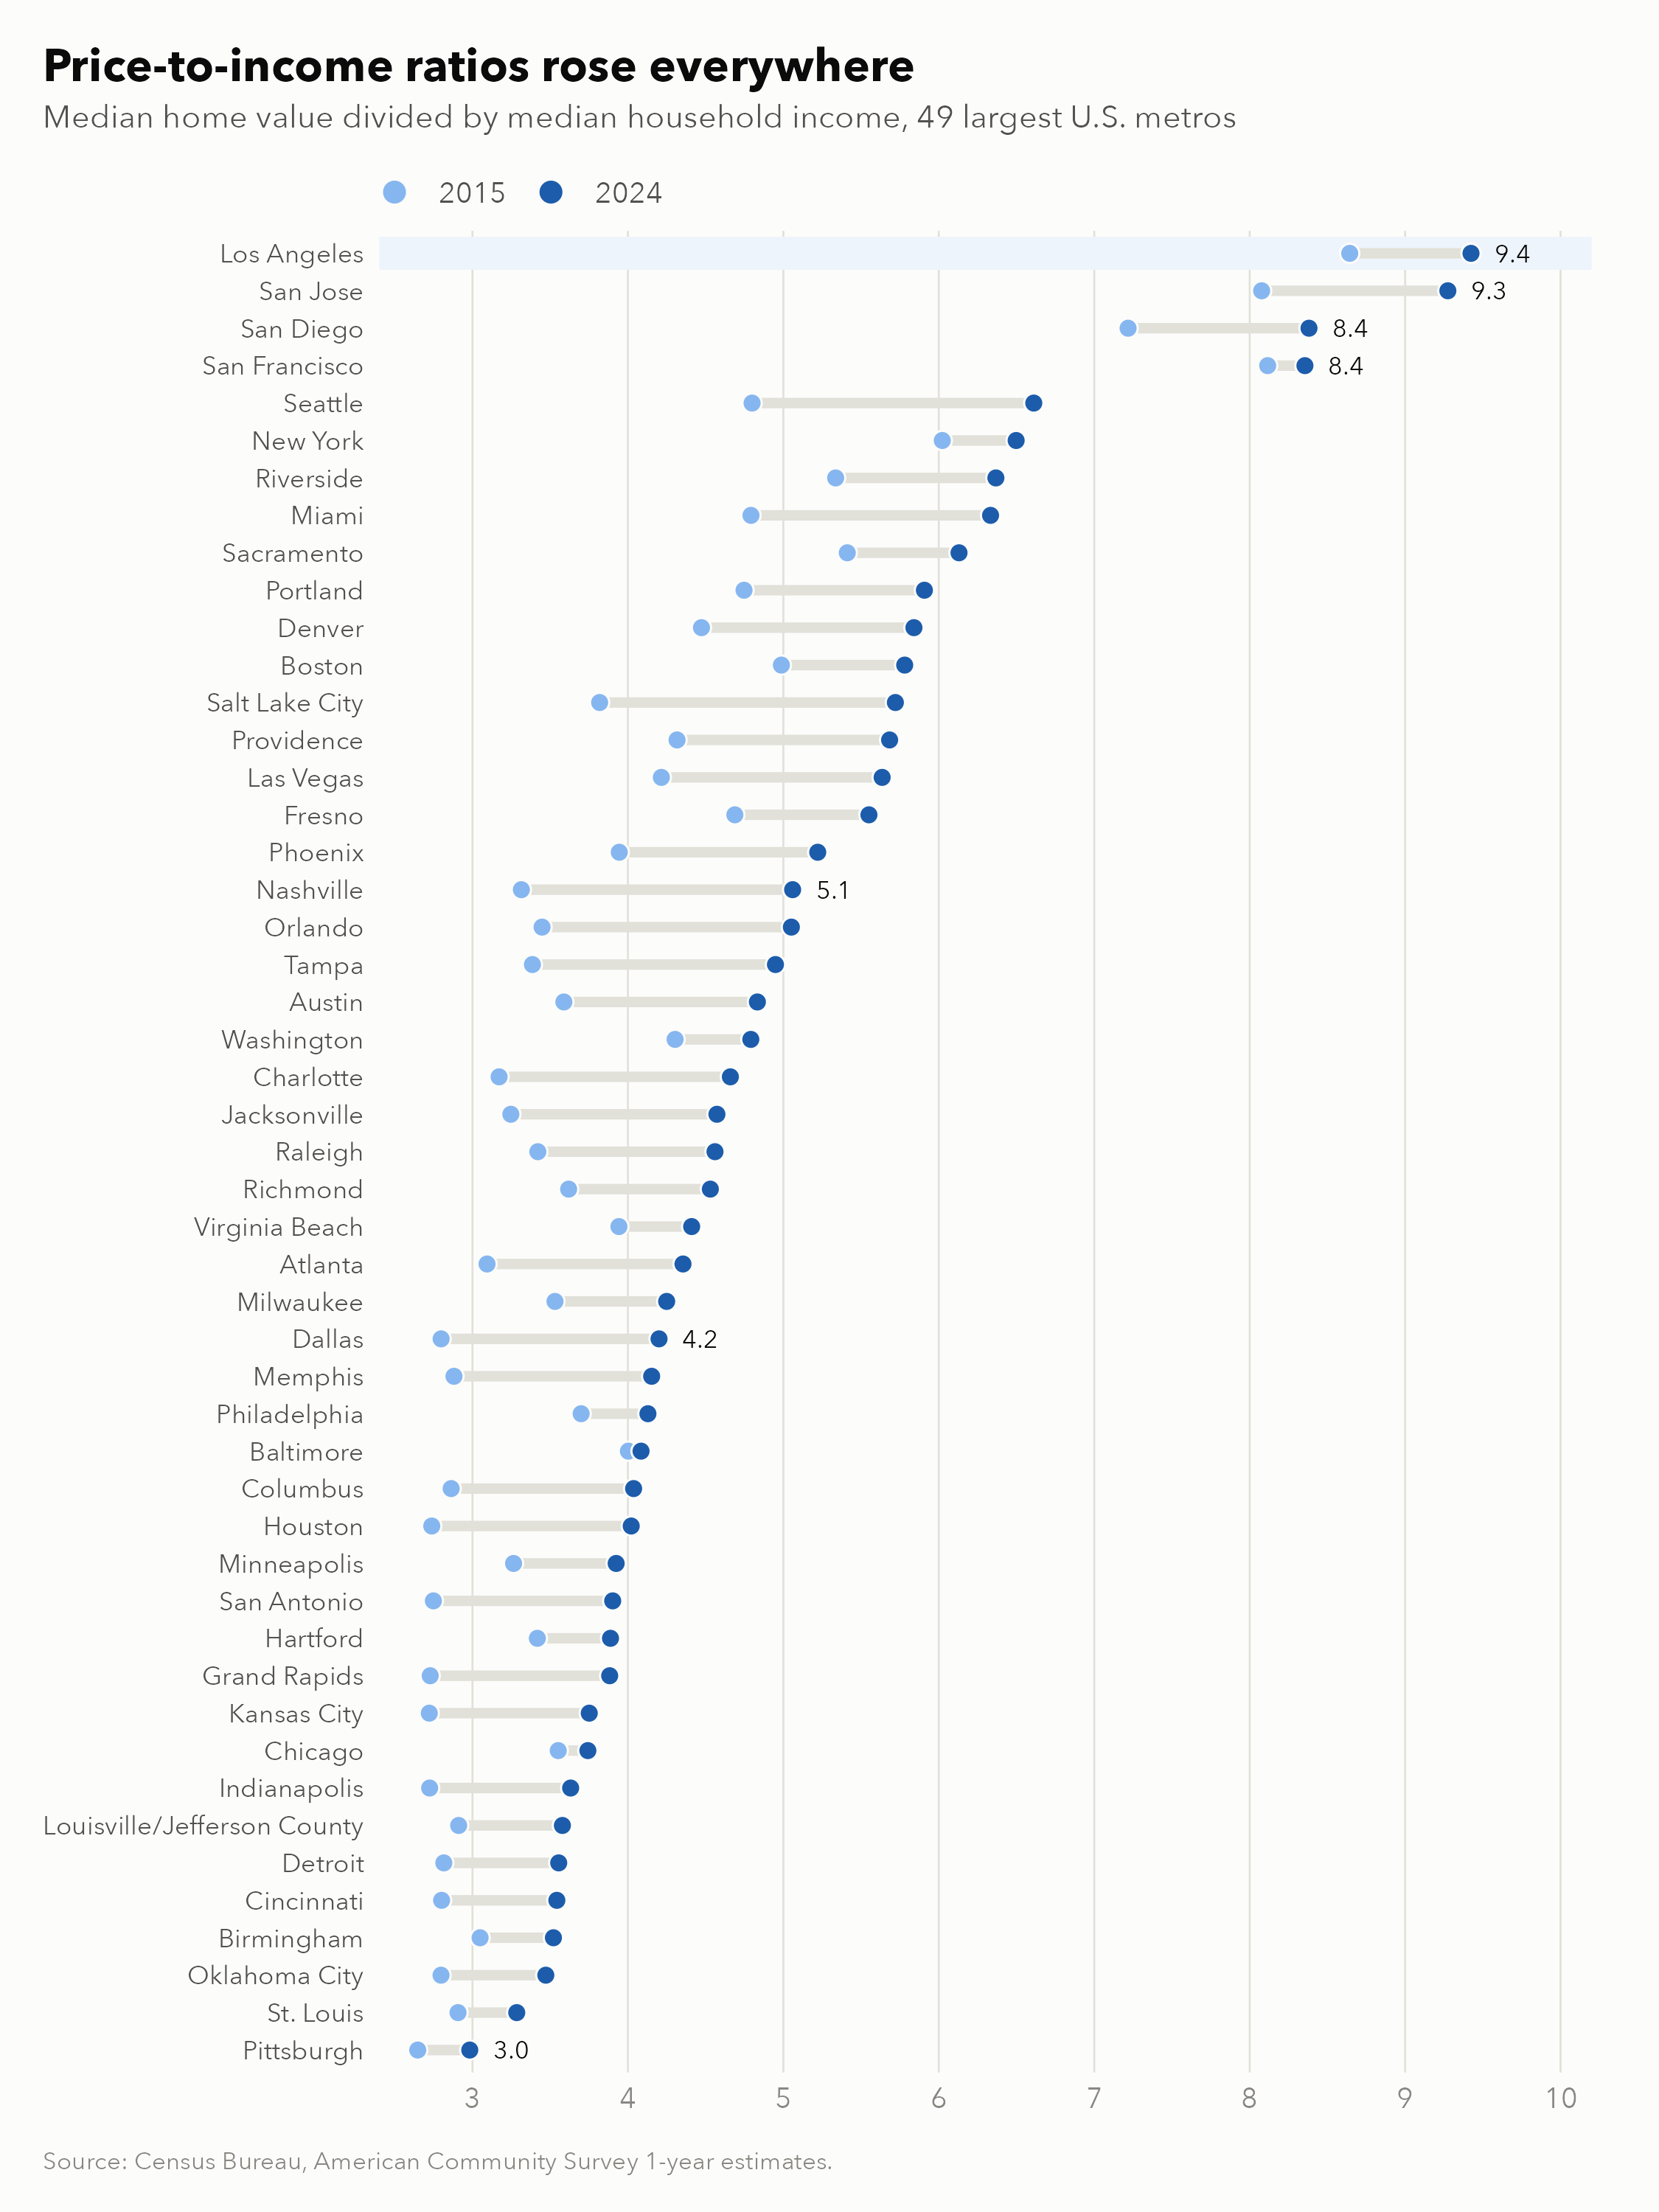
In 2015, 7 of these metros had a value-to-income ratio above 5. By 2024, 19 did. Nashville moved from 3.3 to 5.1, and Dallas from 2.8 to 4.2. Sun Belt metros that once offered affordable ownership are converging toward coastal levels.
Southern California remains at the top of the distribution. Los Angeles has the highest ratio in our sample, at 9.4, up from 8.6 in 2015: a median home value of $908,500 against a median household income of $96,405. San Jose, San Diego, and San Francisco follow, all above 8. Riverside, often seen as the region’s affordable alternative, rose from 5.3 to 6.4. However, starting from very high levels, Southern California saw smaller increases relative to incomes than most of the Sun Belt.
Rents, shown in the figure below, are more mixed.
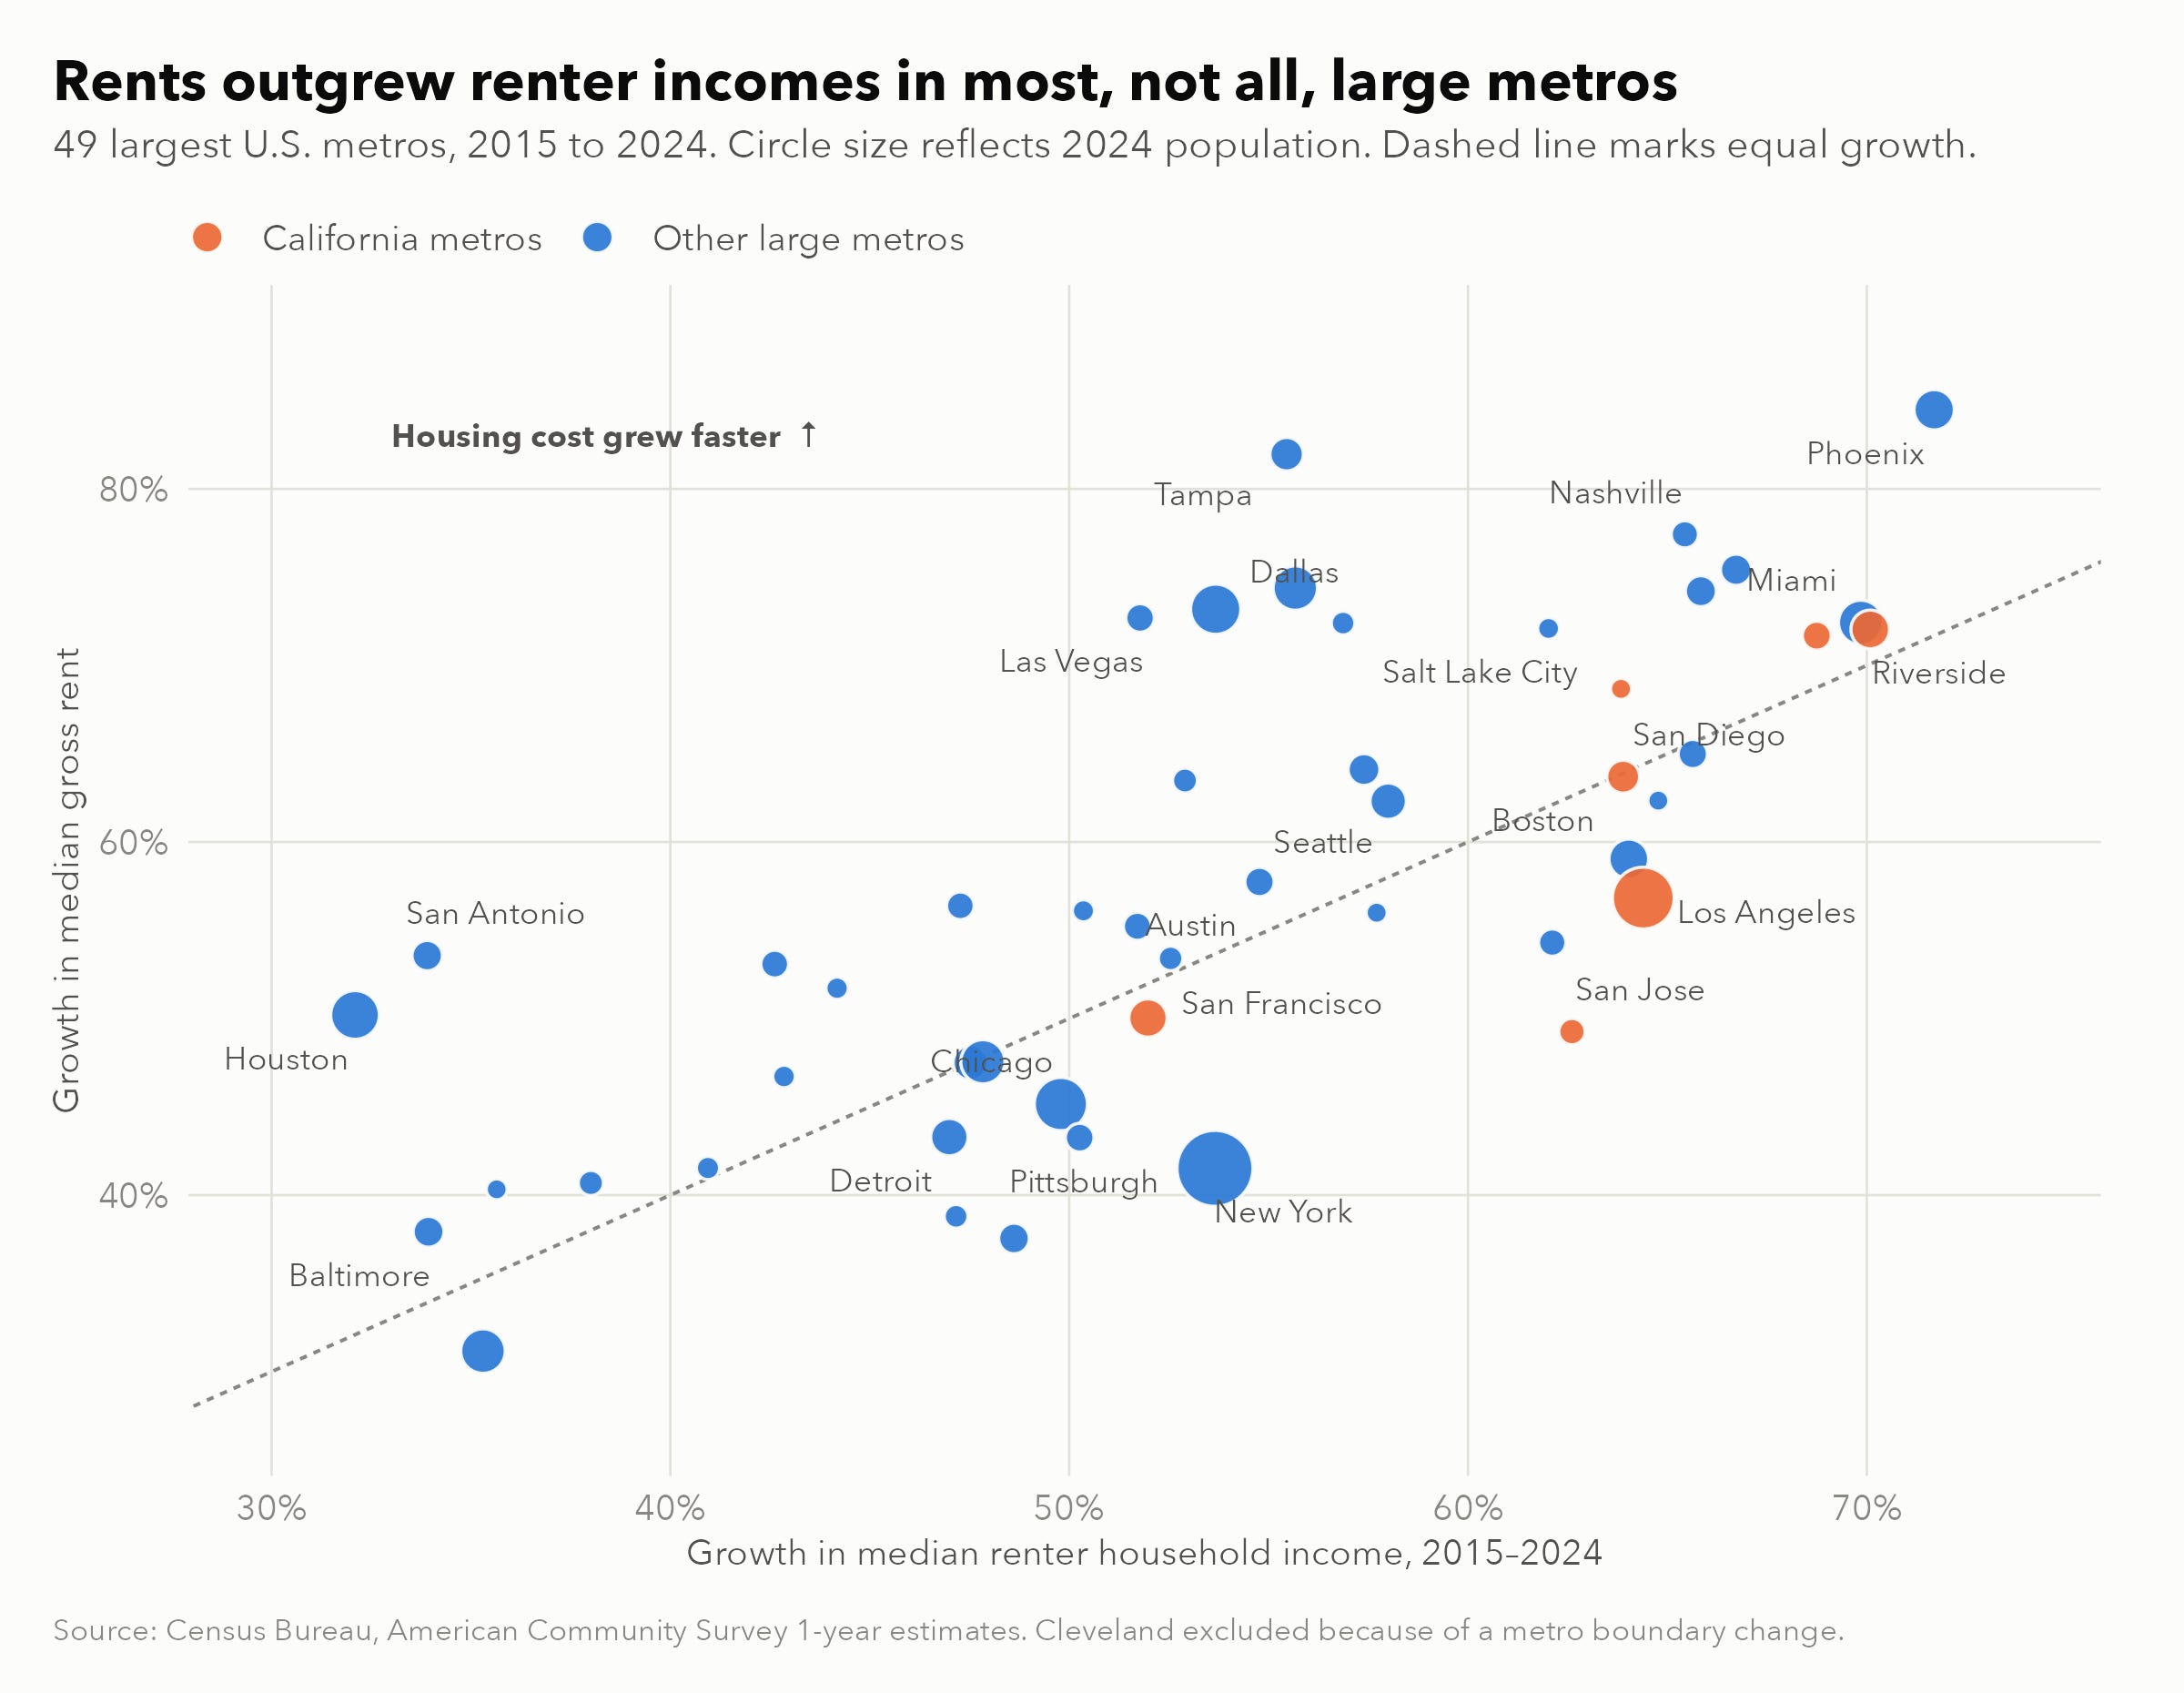
Between 2015 and 2024, rents grew faster than renter incomes in 31 of 49 metros. The gaps are again concentrated in the Sun Belt: Tampa (rents up 82%, renter incomes up 55%), Las Vegas, San Antonio, Dallas, and Houston. In Los Angeles, rents rose 57% while renter incomes rose 64%. Over the shorter 2019 to 2024 window, rents outpaced renter incomes in 43 of 49 metros.
Rent burdens remain highest in Florida and California: the median renter household spends 38.6% of its income on rent in Miami, and about 34% to 36% in Orlando, Tampa, Las Vegas, Riverside, Los Angeles, and San Diego.
A Caution on Renter Incomes
The composition of renter households has changed. In 2015, 4.8 million renter households, or 11% of all renters, earned $100,000 or more. By 2024, this figure had risen to 10.9 million, or 24% of renters. Part of this increase reflects inflation, since the threshold is not adjusted. However, the corresponding share among owners rose by a smaller factor, from 33% to 50%.
This is consistent with higher-income households renting longer as ownership became more expensive. If so, rising median renter income partly reflects who rents, not only raises, and comparisons of rents with renter incomes likely understate the pressure on lower-income renters.
Implications
For policymakers, the evidence suggests that today’s affordability problem is primarily an ownership problem. On average, rents have moved roughly in line with pay for 25 years, though burdens remain high in Florida, California, and much of the Sun Belt. The ownership gap is driven largely by mortgage rates, which local housing policy does not control. The price-driven part, however, likely reflects years of slow supply growth in high-demand markets, which is squarely a local policy question.
For investors, the rapid rise in value-to-income ratios across the Sun Belt suggests that prices there have run ahead of local incomes. Without faster income growth or lower rates, slower appreciation is reasonable to expect going forward.
For researchers, the changing composition of renters is an underappreciated measurement issue: comparisons of rents with renter incomes should account for the growing share of high-income renters.
Conclusion
Over the past 25 years, housing costs have grown faster than pay. However, the post-pandemic period split renting from owning. Rents paid by the typical tenant have absorbed a nearly constant share of median pay since 2000, and wages have largely absorbed the 2021 to 2022 surge in rents on new leases. Owning has become far more expensive: a typical home payment absorbs 35% of a median full-time worker’s pay, up from 23% in 2019, mostly because of higher rates. Across large metros, home values outran incomes everywhere, with the Sun Belt converging toward coastal levels and Southern California still the least affordable region. These benchmarks describe broad trends, not any particular household’s budget.