
A Closer Look at Fire Risk in Los Angeles County

In the aftermath of the devastating fires of January 2025, many questions remain about fire risk in Los Angeles County. In this post, we quantify some key aspects of fire risk exposure.
Our analysis explores the distribution of risk across single-family homes, examines the characteristics and values of risk-exposed properties, and provides estimates of individual homeowners’ wealth exposed to fire risk. We present three key takeaways:
A significant number of single-family homes in the county has non-negligible exposure to fire risk. The total number of at-risk homes is close to the total number of single-family homes in Phoenix.
These at-risk single-family homes are generally larger and more expensive than the average home in the county. At current market prices, their combined value reaches hundreds of billions of dollars.
A rough calculation of home equity suggests that a typical homeowner in a fire-prone area, after 10 years of ownership, has approximately $1 million in equity at risk. Policies aimed at fire mitigation or addressing underinsurance are therefore crucial for protecting homeowners' wealth.
Fire Risk in the County
Our study relies on fire risk exposures from FEMA’s National Risk Index (NRI) Data, reported at the Census tract level as of March 2023. We combine this information with data on residential parcels and with publicly available house price indices from Zillow.
The figure below shows the probability of a large fire occurring over a 10-year period across all Census tracts in Los Angeles County. These 10-year probabilities are based on the annual large fire probabilities made available in the NRI Data.1 While a decade may seem a long time period, it is close to the average tenure of an homeowner in the US.

The map shows that the hilly regions to the west and north of the main metropolitan area have 10-year fire probabilities exceeding 10% (dark red areas). Moreover, vast areas of the county fall in the 5%-10% probability range (red areas), and in the 1%-5% probability range (orange areas).
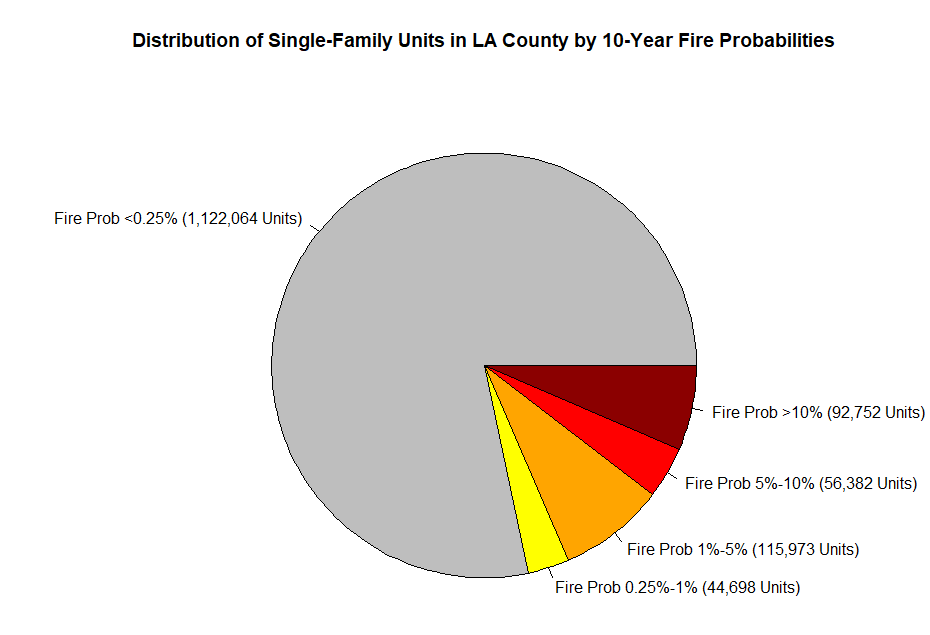
The figure below shows the proportion of single-family homes in the county located in areas with different levels of fire risk exposure. We identify single-family units and their locations using residential parcel data from December 2022. Note that these calculations, along with the rest of the analysis in this post, include the properties affected by the January 2025 fires.
The vast majority (78.4%) of single-family units in the county have a negligible chance of being exposed to a large fire (below 0.25% over 10 years). However, approximately 21.6% of single-family units in the county, or 309,805 homes, are in areas with non-negligible risk. For context, this is close to the number of single-family homes in Phoenix (approximately equal to 320,000). Among these at-risk homes, 56,382 have probability of exposure to a large fire between 5% and 10%, and 92,752 have probability greater than 10%.
Single-Family Homes in Fire-Risk Areas
When we examine the characteristics of the single-family units in at-risk tracts, we find that the majority are the primary residences of their owners. Among the units for which we observe occupancy status, more than 85% are owner-occupied.
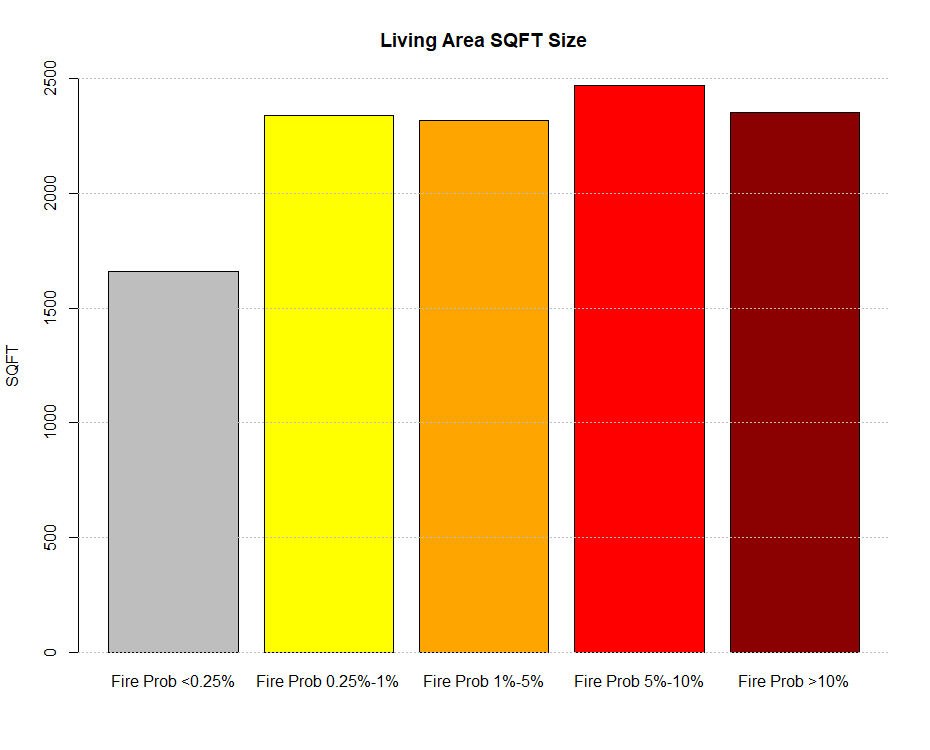
Single-family homes in at-risk areas are on average larger and more expensive than those in areas with negligible risk. The top panel of the figure below shows the average sizes of single-family homes categorized by fire risk. While the average size in areas with negligible risk is 1,660 square feet, the average size in fire-risk areas is 40% larger, and exceeds 2,300 square feet. These size differences can be attributed to the suburban nature of the fire-risk areas.
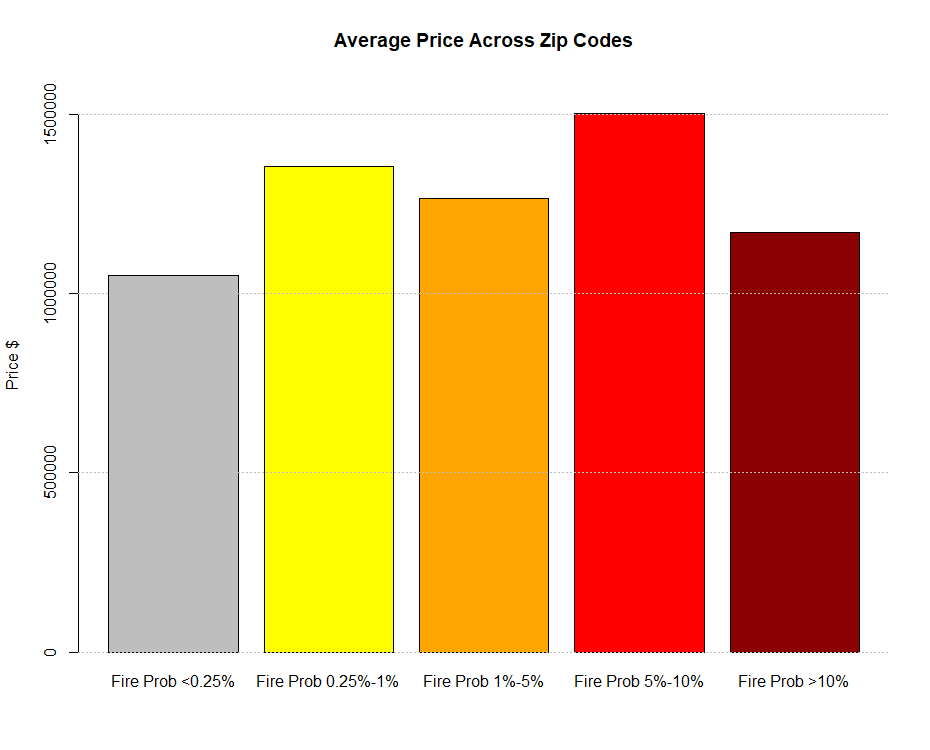
The second panel of the figure compares home prices across areas with different levels of fire risk. This calculation is an approximation based on estimates of zip code-level median single-family home prices available from Zillow, as of December 2024. We match each property with the corresponding zip code index and calculate averages across all properties in areas with different levels of fire risk. The result is a weighted average of the zip code-level price indices.
The figure shows that in the areas with negligible fire risk, the average price per single-family home is approximately $1.05 Million. Prices are higher in fire-risk areas, peaking at an average of $1.5 Million in areas with a fire probability between 5% and 10%. Average prices are equal to $1.17 Million in areas with a fire probability greater than 10%.
Taking the price estimates at face value and multiplying by the total number of properties in each different fire risk area, our estimates imply that approximately $190 billion of housing value is exposed to a fire probability greater than 5% over the next 10 years, and $108 billion is exposed to fire probability greater than 10%. These staggering magnitudes highlight the potential devastating impact of future fires on the county, particularly if fire risk is underinsured.
Implications for Homeowners’ Wealth
Our final set of calculations focuses on quantifying the wealth exposed to fire risk per homeowner. While the home price estimates mentioned above provide a good indication, it is important to consider that homes are typically owned with a mortgage, and that California is a non-recourse state. If a home is impacted by fire, and its value falls below the outstanding mortgage balance, a homeowner can walk away from the mortgage.
The amount of individual household wealth exposed to fire risk is then determined by the amount of equity the household owns in the property. Home equity consists of three components: price appreciation since purchase, the initial down payment, and mortgage principal repayment.
We take the perspective of a homeowner who purchased a single-family home in January 2015, with 85% of the purchase price financed by a fixed-rate mortgage, as is common in the US. The homeowner had an initial mortgage rate at origination of 3.67% (the prevailing rate at the time) and refinanced into a lower rate of 2.68% in December 2020.2 The homeowner bought a house of average price within a fire-risk area and experienced the average price increase in that area between January 2015 and December 2024. We believe these calculations provide a reliable proxy for the home equity of a representative homeowner who did not increase her borrowing with a cash-out refinance during the 10-year tenure period from January 2015 to December 2024.
In the top panel of the figure below, we display the average price appreciation for homes in areas with different levels of fire risk across the county. As noted earlier, this is just one component of home equity. We estimate values ranging from approximately $700,000 to $550,000, with the lowest value realized in the areas with the highest levels of fire risk. These large price appreciations reflect the strong growth that the county has experienced over the last decade. Between 2015 and 2024, home prices across the county increased by 93%.3
Then, in the bottom panel of the figure below, we calculate representative homeowners’ total equity in each risk category, including the initial down payment and mortgage principal repayments. The results show values ranging from $1.15 Million to $925,000. Although the lowest value is observed in the area belonging to the highest fire risk category, overall home equity values are comparable across all fire-risk areas, and equal to about $1 Million.
Thus, the typical homeowner in these areas has substantial wealth exposed to wildfire risk. This has two important implications. First, policies aimed at fire mitigation, and at increasing fire insurance coverage are tremendously valuable to individual homeowners in the at-risk areas.
Second, any decline in house prices in fire-exposed areas can substantially deplete homeowners’ wealth. Price declines might be driven by lower housing demand and relocations (households may become less willing to live in at-risk areas after the recent wildfires). However, these effects may take time to materialize. Housing is undersupplied in the entire county, and if the rebuilding effort following the Eaton and Palisades fires progresses slowly, it could force many impacted households to relocate, putting additional strain on housing production in the entire county, and increasing housing demand in certain locations. This may lead to higher prices in the next months and years (see our previous post).


Based on the NRI Data manual, these probabilities are derived from the burn probability raster generated by the U.S. Forest Service Missoula Fire Sciences Laboratory. The burn probability raster models the annual probability that an area is burned by a large fire (i.e., a fire that escapes initial fire suppression and spreads) at a spatial resolution of 270-meter (0.17-mile) squares. The NRI processes these data to construct annual probabilities of a large fire at the Census block level, which are then aggregated to the Census tract level. These Census tract level estimates are stored in the variable named WFIR_AFREQ. We transform the annual probabilities into 10-year probabilities by assuming independence of fire events over time: 10Year Prob = 1 - (1-Annual Prob)10
Mortgage rates are based on the national mortgage index published by the St. Louis Fed.
Estimate based on the S&P Case Shiller Index for Los Angeles County.